


Billboard.js, the reusable JavaScript chart library backed by D3.js, has released version 1.5.0. Billboard.js provides the easiest way to create a Billboard chart instantly. The new version comes with 7 major improvements and a hoard of additional bug-fixes.
The new radar type chart support has been added to this version for better data visualization. You can use ‘radar’ type, by the set data.types option value. You can also customize these radar types to get a different variation of the visual data.
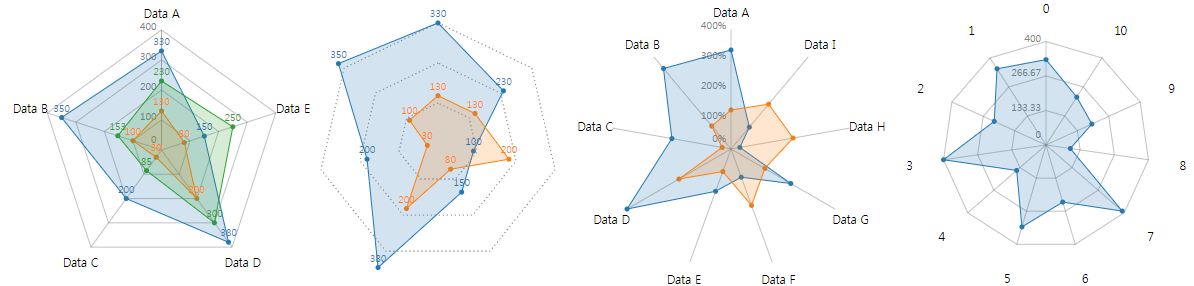
Different radar types
There is also a new way to customize and use axes tick’s text value using axis.[x|y|y2].tick.text.position. For this, you need to just set the position pixel for x and y coordinate value. Thereafter, every value is treated relatively as the original position.
Billboard.js also features a new axis.[x|y].clipPath option which can be used along with tick’s text position option. Generally, the clip-path attribute makes sure that the axes elements are clipped to not surpass the actual axes area. However sometimes, the tick texts aren’t visible due to the clip-path attribute. This is where axis[x|y]. clipPath option comes to play.
There is also improved lining for x-axis. Now the users can put the line on the exact position they want. For this, just put \n character where you want your chart to be lined when you bind the category names for data.
Improved lining for x-axis
Billboard.js also has a new tooltip.linked.name to allow linking charts to particular name groups. So for instance, four charts with two different name groups will be interacting with only the same linked name value.
linked tooltip with grouped name
Read the release notes for additional feature releases and bug fixes. Jae Sung Park, the creator of Billboard.js states that, the next release will feature Multiple Axes and Themed CSS file.
Read Next
Chart Model and Draggable and Droppable Directives
Building Motion Charts with Tableau
How to create a Treemap and Packed Bubble Chart in Tableau


