


bpftrace is a DTrace like tool for troubleshooting kernel problems. It was created about a year ago by Alastair Robertson and the GitHub repository was made public recently. It has plenty of features to relate it to DTrace 2.0.
bpftrace
bpftrace is an open source high level tracing tool which allows analyzing systems. It is now more competent and built for modern extended Berkeley Packet Filter (eBPF). eBPF is a part of the Linux kernel and is popular in systems engineering.
Robertson recently developed struct support, and applied it to tracepoints. Struct support was also applied to kprobes.
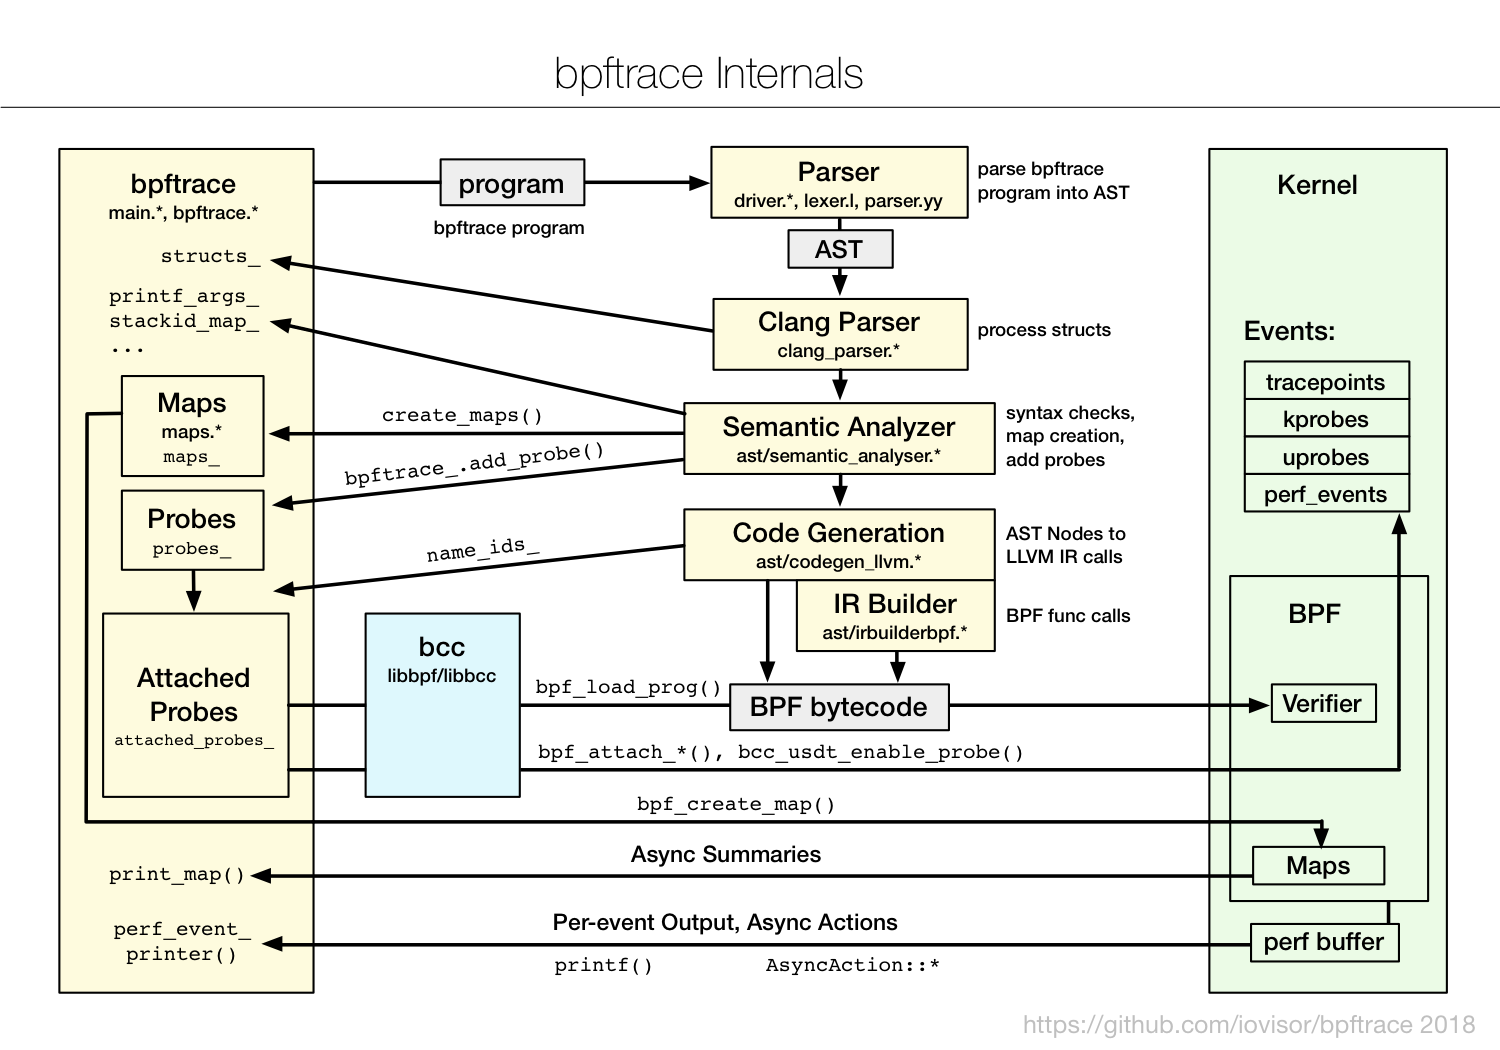
bpftrace uses existing Linux kernel facilities like eBPF, kprobes, uprobes, tracepoints, and perf_events. It also uses bcc libraries. bpftrace uses a lex/yacc parser internally to convert programs into abstract syntax tree (AST). Then llvm intermediate representation actions are done and finally, then BPF is done.
Source: GitHub
bpftrace and DTrace
bpftrace is a higher-level front end for custom ad-hoc tracing. It can play a similar role as DTrace. There are some things eBPF can do and DTrace can’t, one of them being the ability to save and retrieve stack traces as variables.
Brendan Gregg, one of the contributors of bpftrace states in his blog: “We’ve been adding bpftrace features as we need them, not just because DTrace had them. I can think of over a dozen things that DTrace can do that bpftrace currently cannot, including custom aggregation printing, shell arguments, translators, sizeof(), speculative tracing, and forced panics.”
A one-liner tutorial and reference guide is available on GitHub for learning bpftrace.
For more details and trying bpftrace head on to the GitHub repository and Brendan Gregg’s blog.
Read next
NVTOP: An htop like monitoring tool for NVIDIA GPUs on Linux
LLVM 7.0.0 released with improved optimization and new tools for monitoring