In this article by Ravi Kumar Gupta and Yuvraj Gupta, from the book, Mastering Elastic Stack, we will have an overview of Elastic Stack, it's very easy to read a log file of a few MBs or hundreds, so is it to keep data of this size in databases or files and still get sense out of it. But then a day comes when this data takes terabytes and petabytes, and even notepad++ would refuse to open a data file of a few hundred MBs. Then we start to find something for huge log management, or something that can index the data properly and make sense out of it. If you Google this, you would stumble upon ELK Stack. Elasticsearch manages your data, Logstash reads the data from different sources, and Kibana makes a fine visualization of it.
Recently, ELK Stack has evolved as Elastic Stack. We will get to know about it in this article. The following are the points that will be covered in this article:
- Introduction to ELK Stack
- The birth of Elastic Stack
- Who uses the Stack
(For more resources related to this topic, see here.)
Introduction to ELK Stack
It all began with Shay Banon, who started it as an open source project, Elasticsearch, successor of Compass, which gained popularity to become one of the top open source database engines. Later, based on the distributed model of working, Kibana was introduced to visualize the data present in Elasticsearch. Earlier, to put data into Elasticsearch we had rivers, which provided us with a specific input via which we inserted data into Elasticsearch. However, with growing popularity this setup required a tool via which we can insert data into Elasticsearch and have flexibility to perform various transformations on data to make unstructured data structured to have full control on how to process the data. Based on this premise, Logstash was born, which was then incorporated into the Stack, and together these three tools, Elasticsearch, Logstash, and Kibana were named ELK Stack.
The following diagram is a simple data pipeline using ELK Stack:
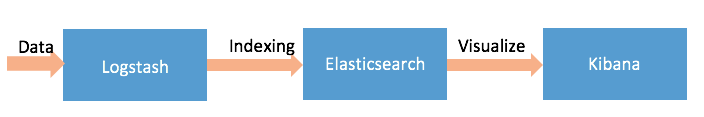
As we can see from the preceding figure, data is read using Logstash and indexed to Elasticsearch. Later we can use Kibana to read the indices from Elasticsearch and visualize it using charts and lists. Let's understand these components separately and the role they play in the making of the Stack.
Logstash
As we got to know that rivers were used initially to put data into Elasticsearch before ELK Stack. For ELK Stack, Logstash is the entry point for all types of data. Logstash has so many plugins to read data from a number of sources and so many output plugins to submit data to a variety of destinations and one of those is the Elasticsearch plugin, which helps to send data to Elasticsearch.
After Logstash became popular, eventually rivers got deprecated as they made the cluster unstable and also performance issues were observed.
Logstash does not ship data from one end to another; it helps us with collecting raw data and modifying/filtering it to convert it to something meaningful, formatted, and organized. The updated data is then sent to Elasticsearch. If there is no plugin available to support reading data from a specific source, or writing the data to a location, or modifying it in your way, Logstash is flexible enough to allow you to write your own plugins.
Simply put, Logstash is open source, highly flexible, rich with plugins, can read your data from your choice of location, normalizes it as per your defined configurations, and sends it to a particular destination as per the requirements.
Elasticsearch
All of the data read by Logstash is sent to Elasticsearch for indexing. There is a lot more than just indexing. Elasticsearch is not only used to index data, but it is a full-text search engine, highly scalable, distributed, and offers many more things. Elasticsearch manages and maintains your data in the form of indices, offers you to query, access, and aggregate the data using its APIs. Elasticsearch is based on Lucene, thus providing you all of the features that Lucene does.
Kibana
Kibana uses Elasticsearch APIs to read/query data from Elasticsearch indices to visualize and analyze in the form of charts, graphs and tables. Kibana is in the form of a web application, providing you a highly configurable user interface that lets you query the data, create a number of charts to visualize, and make actual sense out of the data stored.
After a robust ELK Stack, as time passed, a few important and complex demands took place, such as authentication, security, notifications, and so on. This demand led for few other tools such as Watcher (providing alerting and notification based on changes in data), Shield (authentication and authorization for securing clusters), Marvel (monitoring statistics of the cluster), ES-Hadoop, Curator, and Graph as requirement arose.
The birth of Elastic Stack
All the jobs of reading data were done using Logstash, but that's resource consuming. Since Logstash runs on JVM, it consumes a good amount of memory. The community realized the need of improvement and to make the pipelining process resource friendly and lightweight. Back in 2015, Packetbeat was born, a project which was an effort to make a network packet analyzer that could read from different protocols, parse the data, and ship to Elasticsearch. Being lightweight in nature did the trick and a new concept of Beats was formed. Beats are written in Go programming language. The project evolved a lot, and now ELK stack was no more than just Elasticsearch, Logstash, and Kibana, but Beats also became a significant component. The pipeline now looked as follows:
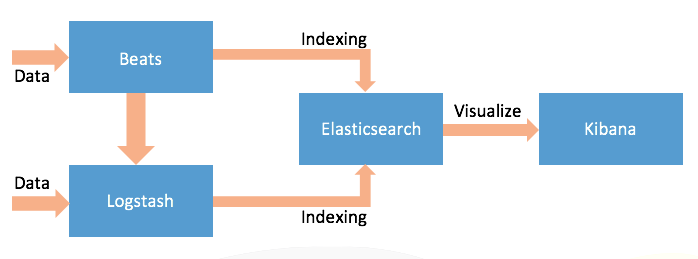
Beat
A Beat reads data, parses it, and can ship to either Elasticsearch or Logstash. The difference is that they are lightweight, serve a specific purpose, and are installed as agents. There are few beats available such as Topbeat, Filebeat, Packetbeat, and so on, which are supported and provided by the Elastic.co and a good number of Beats already written by the community. If you have a specific requirement, you can write your own Beat using the libbeat library.
In simple words, Beats can be treated as very light weight agents to ship data to either Logstash or Elasticsearch and offer you an infrastructure using the libbeat library to create your own Beats.
Unlock access to the largest independent learning library in Tech for FREE!
Get unlimited access to 7500+ expert-authored eBooks and video courses covering every tech area you can think of.
Renews at $19.99/month. Cancel anytime
Together Elasticsearch, Logstash, Kibana, and Beats become Elastic Stack, formally known as ELK Stack. Elastic Stack did not just add Beats to its team, but they will be using the same version always. The starting version of the Elastic Stack will be 5.0.0 and the same version will apply to all the components.
This version and release method is not only for Elastic Stack, but for other tools of the Elastic family as well. Due to so many tools, there was a problem of unification, wherein each tool had their own version and every version was not compatible with each other, hence leading to a problem. To solve this, now all of the tools will be built, tested, and released together.
All of these components play a significant role in creating a pipeline. While Beats and Logstash are used to collect the data, parse it, and ship it, Elasticsearch creates indices, which is finally used by Kibana to make visualizations. While Elastic Stack helps with a pipeline, other tools add security, notifications, monitoring, and other such capabilities to the setup.
Who uses Elastic Stack?
In the past few years, implementations of Elastic Stack have been increasing very rapidly. In this section, we will consider a few case studies to understand how Elastic Stack has helped this development.
Salesforce
Salesforce developed a new plugin named ELF (Event Log Files) to collect Salesforce logged data to enable auditing of user activities. The purpose was to analyze the data to understand user behavior and trends in Salesforce.
The plugin is available on GitHub at https://github.com/developerforce/elf_elk_docker.
This plugin simplifies the Stack configuration and allows us to download ELF to get indexed and finally sensible data that can be visualized using Kibana. This implementation utilizes Elasticsearch, Logstash, and Kibana.
CERN
There is not just one use case that Elastic Stack helped CERN (European Organization for Nuclear Research), but five. At CERN, Elastic Stack is used for the following:
- Messaging
- Data monitoring
- Cloud benchmarking
- Infrastructure monitoring
- Job monitoring
Multiple Kibana dashboards are used by CERN for a number of visualizations.
Green Man Gaming
This is an online gaming platform where game providers publish their games. The website wanted to make a difference by proving better gameplay. They started using Elastic Stack to do log analysis, search, and analysis of gameplay data.
They began with setting up Kibana dashboards to gain insights about the counts of gamers by the country and currency used by gamers. That helped them to understand and streamline the support and help in order to provide an improved response.
Apart from these case studies, Elastic Stack is used by a number of other companies to gain insights of the data they own. Sometimes, not all of the components are used, that is, not all of the times a Beat would be used and Logstash would be configured. Sometimes, only an Elasticsearch and Kibana combination is used.
If we look at the users within the organization, all of the titles who are expected to do big data analysis, business intelligence, data visualizations, log analysis, and so on, can utilize Elastic Stack for their technical forte. A few of these titles are data scientists, DevOps, and so on.
Stack competitors
Well, it would be wrong to call for Elastic Stack competitors because Elastic Stack has been emerged as a strong competitor to many other tools in the market in recent years and is growing rapidly. A few of these are:
- Open source:
- Others:
- Kibana competitors:
- Elasticsearch competitors:
Most of these compare with respect to log management, while Elastic Stack is much more than that. It offers you the ability to analyze any type of data and not just logs.
Resources for Article:
Further resources on this subject:

 United States
 Great Britain
 India
India
 Germany
 France
 Canada
 Russia
 Spain
Spain
 Brazil
 Australia
 Singapore
 Canary Islands
 Hungary
 Ukraine
 Luxembourg
 Estonia
 Lithuania
 South Korea
 Turkey
 Switzerland
 Colombia
 Taiwan
 Chile
Chile
 Norway
 Ecuador
 Indonesia
 New Zealand
 Cyprus
 Denmark
 Finland
 Poland
 Malta
Malta
 Czechia
 Austria
 Sweden
 Italy
Italy
 Egypt
Egypt
 Belgium
 Portugal
 Slovenia
 Ireland
 Romania
 Greece
 Argentina
 Netherlands
 Bulgaria
 Latvia
 South Africa
 Malaysia
 Japan
Japan
 Slovakia
 Philippines
 Mexico
 Thailand


