
In this article by Rajat Mehta, author of the book Big Data Analytics with Java, we will learn about graphs. Graphs theory is one of the most important and interesting concepts of computer science. Graphs have been implemented in real life in a lot of use cases. If you use a GPS on your phone or a GPS device and it shows you a driving direction to a place, behind the scene there is an efficient graph that is working for you to give you the best possible direction. In a social network you are connected to your friends and your friends are connected to other friends and so on. This is a massive graph running in production in all the social networks that you use. You can send messages to your friends or follow them or get followed all in this graph. Social networks or a database storing driving directions all involve massive amounts of data and this is not data that can be stored on a single machine, instead this is distributed across a cluster of thousands of nodes or machines. This massive data is nothing but big data and in this article we will learn how data can be represented in the form of a graph so that we make analysis or deductions on top of these massive graphs.
In this article, we will cover:
- A small refresher on the graphs and its basic concepts
- A small introduction on graph analytics, its advantages and how Apache Spark fits in
- Introduction on the GraphFrames library that is used on top of Apache Spark

Before we dive deeply into each individual section, let’s look at the basic graph concepts in brief.
(For more resources related to this topic, see here.)
Refresher on graphs
In this section, we will cover some of the basic concepts of graphs, and this is supposed to be a refresher section on graphs. This is a basic section, hence if some users already know this information they can skip this section. Graphs are used in many important concepts in our day-to-day lives. Before we dive into the ways of representing a graph, let’s look at some of the popular use cases of graphs (though this is not a complete list)
- Graphs are used heavily in social networks
- In finding driving directions via GPS
- In many recommendation engines
- In fraud detection in many financial companies
- In search engines and in network traffic flows
- In biological analysis
As you must have noted earlier, graphs are used in many applications that we might be using on a daily basis.
Graphs is a form of a data structure in computer science that helps in depicting entities and the connection between them. So, if there are two entities such as Airport A and Airport B and they are connected by a flight that takes, for example, say a few hours then Airport A and Airport B are the two entities and the flight connecting between them that takes those specific hours depict the weightage between them or their connection. In formal terms, these entities are called as vertexes and the relationship between them are called as edges. So, in mathematical terms, graph G = {V, E},that is, graph is a function of vertexes and edges. Let’s look at the following diagram for the simple example of a graph:
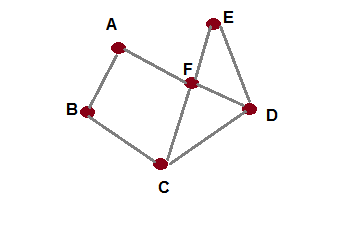
As you can see, the preceding graph is a set of six vertexes and eight edges,as shown next:
Vertexes = {A, B, C, D, E, F}
Edges = { AB, AF, BC, CD, CF, DF, DE, EF}
These vertexes can represent any entities, for example, they can be places with the edges being ‘distances’ between the places or they could be people in a social network with the edges being the type of relationship, for example, friends or followers. Thus, graphs can represent real-world entities like this.
The preceding graph is also called a bidirected graph because in this graph the edges go in either direction that is the edge from A to B can be traversed both ways from A to B as well as from B to A. Thus, the edges in the preceding diagrams that is AB can be BA or AF can be FA too. There are other types of graphs called as directed graphs and in these graphs the direction of the edges go in one way only and does not retrace back. A simple example of a directed graph is shown as follows:.
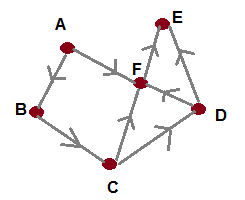
As seen in the preceding graph, the edge A to B goes only in one direction as well as the edge B to C. Hence, this is a directed graph.
A simple linked list data structure or a tree datastructure are also forms of graph only. In a tree, nodes can have children only and there are no loops, while there is no such rule in a general graph.
Representing graphs
Visualizing a graph makes it easily comprehensible but depicting it using a program requires two different approaches
- Adjacency matrix: Representing a graph as a matrix is easy and it has its own advantages and disadvantages. Let’s look at the bidirected graph that we showed in the preceding diagram. If you would represent this graph as a matrix, it would like this:
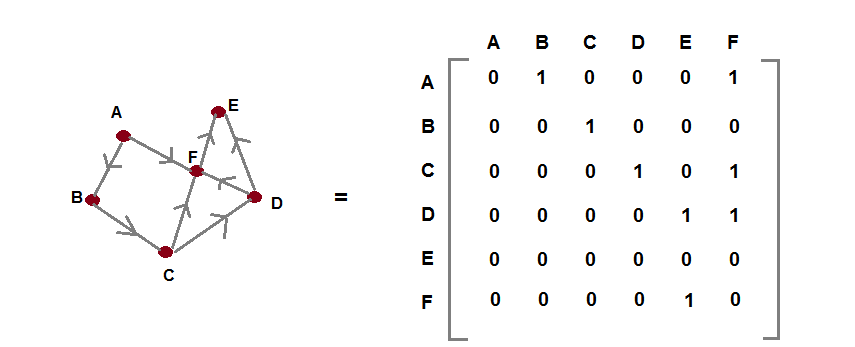
The preceding diagram is a simple representation of our graph in matrix form. The concept of matrix representation of graph is simple—if there is an edge to a node we mark the value as 1, else, if the edge is not present, we mark it as 0. As this is a bi-directed graph, it has edges flowing in one direction only. Thus, from the matrix, the rows and columns depict the vertices. There if you look at the vertex A, it has an edge to vertex B and the corresponding matrix value is 1.
As you can see, it takes just one step or O[1]to figure out an edge between two nodes. We just need the index (rows and columns) in the matrix and we can extract that value from it. Also, if you would have looked at the matrix closely, you would have seen that most of the entries are zero, hence this is a sparse matrix. Thus, this approach eats a lot of space in computer memory in marking even those elements that do not have an edge to each other, and this is its main disadvantage.
- Adjacency list: Adjacency list solves the problem of space wastage of adjacency matrix. To solve this problem, it stores the node and its neighbors in a list (linked list) as shown in the following diagram:
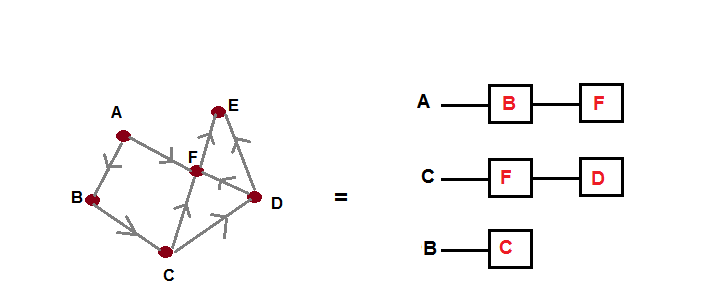
For maintaining brevity, we have not shown all the vertices but you can make out from the diagram that each vertex is storing its neighbors in a linked list. So when you want to figure out the neighbors of a particular vertex, you can directly iterate over the list. Of course this has the disadvantage of iterating when you have to figure out whether an edge exists between two nodes or not. This approach is also widely used in many algorithms in computer science.
We have briefly seen how graphs can be represented, let’s now see some important terms that are used heavily on graphs.
Common terminology on graphs
We will now introduce you to some common terms and concepts in graphs that you can use in your analytics on top of graphs:
- Vertices:As we mentioned earlier, vertices are the mathematical terms for the nodes in a graph. For analytic purposes, thevertices count shows the number of nodes in the system, for example, the number of people involved in a social graph.
- Edges: As we mentioned earlier, edges are the connection between vertices and edges can carry weights. The number of edges represent the number of relations in a system of graph. The weight on a graph represents the intensity of the relationship between the nodes involved; for example, in a social network, the relationship of friends is a stronger relationship than followed between nodes.
- Degrees: Represent the total number of connections flowing into as well as out of a node. For example, in the previous diagram the degree of node F is four. The degree count is useful, for example, in a social network graph it can represent how well a person is connected if his degree count is very high.
- Indegrees: This represents the number of connections flowing into a node. For example, in the previous diagram, for node F the indegree value is three. In a social network graph, this might represent how many people can send messages to this person or node.
- Oudegrees: This represents the number of connections flowing out of a node. For example, in the previous diagram, for node F the outdegree value is one. In a social network graph, this might represent how many people can send messages to this person or node.
Common algorithms on graphs
Let’s look at the three common algorithms that are run on graphs frequently and some of their uses:
- Breadth first search: Breadth first search is an algorithm for graph traversal or searching. As the name suggests, the traversal occurs across the breadth of the graphs that is to say the neighbors of the node form where traversal starts are searched first before exploring further in the same manner. We will refer to the same graph we used earlier:
If we start at vertex A, then according to breadth first search next we search or go at the neighbors of A that’s B and F. After that, we will go at the neighbors of B and that will be C. Next we will go to the neighbours of F and those will be E and D. We only go through each node once and this mimics real-life travel as well, as to reach from a point to another point we seldom cover the same road or path again.
Thus, our breadth first traversal starting from A will be {A , B , F , C , D , E }.
Breadth first search is very useful in graph analytics and can tell us things such as the friends that are not your immediate friends but just at the next level after your immediate friends in a social network or in the case of a graph of a flights network it can show flights with just a single stop or two stops to the destination.
- Depth first search: This is another way of searching where we start from the source vertice and keep on searching until we reach the end node or the leaf node and then we backtrack. This algorithm is not as performant as the bread first search as it requires lots of traversals. So if you want to know if a node A is connected to node B, you might end up searching along a lot of wasteful nodes that do not have anything to do with the original nodes A and B before coming at the appropriate solution.
- Dijkstra’s shortest path: This is a greedy algorithm to find the shortest path in a graph network. So in a weighted graph, if you need to find the shortest path between two nodes, you can start from the starting node and keep on picking the next node in path greedily to be the one with the least weight (in the case of weights being distances between nodes like in city graphs depicting interconnecting cities and roads).So in a road network, you can find the shortest path between two cities using this algorithm.
- PageRank algorithm: This is a very popular algorithm that came out from Google and it essentially is used to find the importance of a web page by figuring out how connected it is to other important websites. It gives a page rank score to each of the websites based on this approach and finally the search results are built based on this score. The best part about this algorithm is it can be applied to other areas in life too, for example, in figuring out the important airports in a flight graph, or figuring out the most important people in a social network group.
So much for the basics and refresher on graphs, in the next section, we will now see how graphs can be used in real world in massive datasets such as social network data or in data used in the field of biology. We will also study how graph analytics can be used on top of these graphs to derive exclusive deductions.
Plotting graphs
There is a handy open source Java library called GraphStream, which can be used to plot graphs and this is very useful specially if you want to view the structure of your graphs. While viewing, you can also figure out if some of the vertices are very close to each other (clustered) or in general how they are placed.
Using the GraphStream library is easy. Just download the jar from http://graphstream-project.org and put it in the classpath of your project. Next, we will show a simple example demonstrating how easy it is to plot a graph using this library.
Just create an instance of a graph. For our example, we will create a simple DefaultGraph and name it SimpleGraph. Next, we will add the nodes or vertices of the graph. We will also add the attribute of the label that is displayed on the vertice.
Graph graph = newDefaultGraph("SimpleGraph");
	graph.addNode("A" ).setAttribute("ui.label", "A");
	graph.addNode("B" ).setAttribute("ui.label", "B");
	graph.addNode("C" ).setAttribute("ui.label", "C");
After building the nodes, it’s now time to connect these nodes using the edges. The API is simple to use and on the graph instance we can define the edges, provided an ID is given to them and the starting and ending nodes are also given.
graph.addEdge("AB", "A", "B");
graph.addEdge("BC", "B", "C");
graph.addEdge("CA", "C", "A");
All the information of nodes and edges is present on the graph instance. It’s now time to plot this graph on the UI and we can just invoke the display method on the graph instance as shown next and display it on the UI.
graph.display();This would plot the graph on the UI as follows:
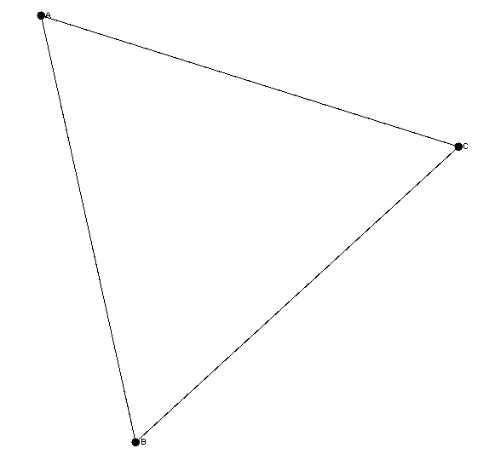
This library is extensive and it will be good learning experience to explore this library further and we would urge the readers to further explore this library on their own.
Massive graphs on big data
- Big data comprises huge amount of data distributed across a cluster of thousands (if not more) of machines. Building graphs based on this massive data has different challenges shown as follows:
- Due to the vast amount of data involved, the data for the graph is distributed across a cluster of machines. Hence, in actuality, it’s not a single node graph and we have to build a graph that spans across a cluster of machines.
- A graph that spans across a cluster of machines would have vertices and edges spread across different machines and this data in a graph won’t fit into the memory of one single machine. Consider your friend’s list on Facebook; some of your friend’s data in your Facebook friend list graph might lie on different machines and this data might be just tremendous in size. Look at an example diagram of a graph of 10 Facebook friends and their network shown as follows:
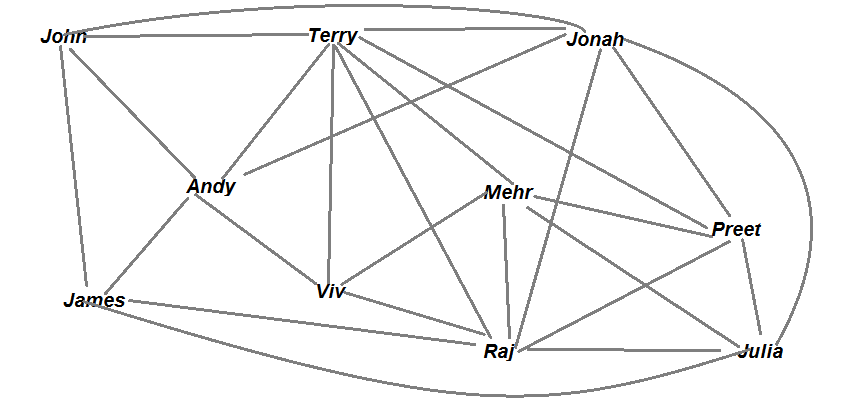
As you can see in the preceding diagram, when for just 10 friends the data can be huge, and here since the graph is drawn by hand we have not even shown a lot of connections to make the image comprehensible, but in real life each person can have say more than thousands of connections. So imagine what will happen to a graph with say thousands if not more people on the list.
As shown in the reasons we just saw, building massive graphs on big data is a different ball game altogether and there are few main approaches for building this massive graphs. From the perspective of big data building the massive graphs involve running and storing data parallely on many nodes. The two main approaches are bulk synchronous parallely and the pregel approach. Apache Spark follows the pregel approach. Covering these approaches in detail is out of scope of this book and if the users are interested more on these topics they should refer to other books and the Wikipedia for the same.
Graph analytics
The biggest advantage to using graphs is you can analyze these graphs and use them for analyzing complex datasets. You might ask what is so special about graph analytics that we can’t do by relational databases. Let’s try to understand this using an example, suppose we want to analyze your friends network on Facebook and pull information about your friends such as their name, their birth date, their recent likes, and so on. If Facebook had a relational database, then this would mean firing a query on some table using the foreign key of the user requesting this info. From the perspective of relational database, this first level query is easy. But what if we now ask you to go to the friends at level four in your network and fetch their data (as shown in the following diagram). The query to get this becomes more and more complicated from a relational database perspective but this is a trivial task on a graph or graphical database (such as Neo4j). Graphs are extremely good on operations where you want to pull information from one end of the node to another, where the other node lies after a lot of joins and hops. As such, graph analytics is good for certain use cases (but not for all use cases, relation database are still good on many other use cases).
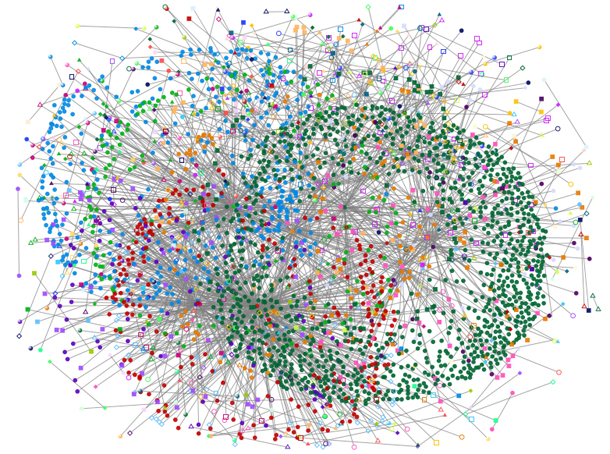
As you can see, the preceding diagram depicts a huge social network (though the preceding diagram might just be depicting a network of a few friends only). The dots represent actual people in a social network. So if somebody asks to pick one user on the left-most side of the diagram and see and follow host connections to the right-most side and pull the friends at the say 10th level or more, this is something very difficult to do in a normal relational database and doing it and maintaining it could easily go out of hand.
There are four particular use cases where graph analytics is extremely useful and used frequently (though there are plenty more use cases too)
- Path analytics: As the name suggests, this analytics approach is used to figure out the paths as you traverse along the nodes of a graph. There are many fields where this can be used—simplest being road networks and figuring out details such as shortest path between cities, or in flight analytics to figure out the shortest time taking flight or direct flights.
- Connectivity analytics: As the name suggests, this approach outlines how the nodes within a graph are connected to each other. So using this you can figure out how many edges are flowing into a node and how many are flowing out of the node. This kind of information is very useful in analysis. For example, in a social network if there is a person who receives just one message but gives out say ten messages within his network then this person can be used to market his favorite products as he is very good in responding to messages.
- Community Analytics: Some graphs on big data are huge. But within these huge graphs there might be nodes that are very close to each other and are almost stacked in a cluster of their own. This is useful information as based on this you can extract out communities from your data. For example, in a social network if there are people who are part of some community, say marathon runners, then they can be clubbed into a single community and further tracked.
- Centrality Analytics: This kind of analytical approach is useful in finding central nodes in a network or graph. This is useful in figuring out sources that are single handedly connected to many other sources. It is helpful in figuring out influential people in a social network, or a central computer in a computer network.
From the perspective of this article, we will be covering some of these use cases in our sample case studies and for this we will be using a library on Apache Spark called GraphFrames.
GraphFrames
GraphX library is advanced and performs well on massive graphs, but, unfortunately, it’s currently only implemented in Scala and does not have any direct Java API. GraphFrames is a relatively new library that is built on top of Apache Spark and provides support for dataframe (now dataset) based graphs.It contains a lot of methods that are direct wrappers over the underlying sparkx methods. As such it provides similar functionality as GraphX except that GraphX acts on the Spark SRDD and GraphFrame works on the dataframe so GraphFrame is more user friendly (as dataframes are simpler to use). All the advantages of firing Spark SQL queries, joining datasets, filtering queries are all supported on this.
To understand GraphFrames and representing massive big data graphs, we will take small baby steps first by building some simple programs using GraphFrames before building full-fledged case studies.
Summary
In this article, we learned about graph analytics. We saw how graphs can be built even on top of massive big datasets. We learned how Apache Spark can be used to build these massive graphs and in the process we learned about the new library GraphFrames that helps us in building these graphs.
Resources for Article:
Further resources on this subject:
- Saying Hello to Java EE [article]
- Object-Oriented JavaScript [article]
- Introduction to JavaScript [article]