Slacks massive popularity as a team messaging platform has brought up some age-old questions about productivity in the workplace. Does ease of communication really enable us to get more done day-to-day? Or is it just another distraction in the sea of our notification panel? Using the Slack RTM(Real-Time Messaging) API, we can follow just how much of our day we spend collaborating, making business-critical decisions, and sharing cat GIFs.
A word on the Real-Time Messaging API
Much of Slack’s success can be attributed the plethora of bots, integrations, and apps available for the platform. While many are built on the robust Web API, the Real-Time Messaging API provides a stream comprised of over 65 different events as they happen, making it an ideal choice for analyzing your own messaging habits. Events types include file uploads, emoji usage, user status, joining and leaving a channel, and many more.
Since it's difficult to gauge how long we spend reading or thinking about conversations in Slack, we'll use a metric we do know with a bit of certainty—time spent typing. Fortunately, this is also a specific event type broadcast from the RTM API: user_typing. Unlike most web APIs, connections to the RTM API are made over a persistent websocket. We'll use the SlackSocket Python library to listen in on events as they come in.
Recording events
To start, we'll need to gather and record event data across a period of time. Creating a SlackSocket object filtered by event type is fairly straightforward:
Since we're only concerned with following a single type of event, an event_filter is added so that we won't have to read and filter every incoming message in our code.
According to the documentation, a user_typing event is sent:
on every key press in the chat input unless one has been sent in the last three seconds
For the sake of our analysis, we'll assume that each of these events accounts for three seconds of a user’s time.
importos
fromdatetimeimportdatetime
for event inslack.events():
now=datetime.now().timestamp() # get the current epoch timestamp
withopen('typing.csv', 'a') as of:
of.write('%s,%s'% (now, event.event['user']))
Our typing will be logged in CSV format with a timestamp and the corresponding user that triggered the event.
Plotting with matplotlib
After we've collected a sufficient amount of data(a day in this case) on our typing events, we can plot it out in a separate script using matplotlib.
We'll read in all of the data, filtering for our user:
Unlock access to the largest independent learning library in Tech for FREE!
Get unlimited access to 7500+ expert-authored eBooks and video courses covering every tech area you can think of.
Renews at $19.99/month. Cancel anytime
importos
fromdatetimeimportdatetime
importmatplotlib.pyplotasplt
withopen('typing.log') as of:
data= [ l.strip('n').split(',') for l inof.readlines() ]
x = []
y = []
forts, user in data:
if user =='bradley':
x.append(datetime.fromtimestamp(float(ts))) # convert epoch timestamp to datetime object
y.append(3) # seconds of typing
Epoch timestamps are converted back into datetime objects to ensure that matplotlib can display them correctly along the x-axis.
Create the plot and export as a PNG:
plt.plot(x,y)
plt.gcf().autofmt_xdate() # make the x-labels nicer for timestamps
plt.savefig('typing.png')
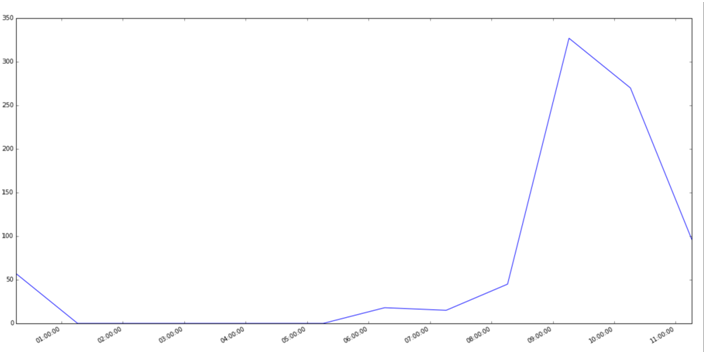
Results:
Not a particularly eventful morning(at least until I'd had my coffee), but enough to infer that I'm rarely spending more than five minutes an hour here in active discussion. Another data point missing from our observation is the number of messages in comparison to the time spent typing. If a message was rewritten or partially written and retracted, this could account for quite a bit of typing time without producing much in terms of message content.
A playground for analytics
There's quite a bit of fun and insight to be had watching just this single user_typing event. Likewise, tracking any number of the 65+ other events broadcast by Slack’s RTM API works well to create an interesting and multi-layered dataset ripe for analysis.
The code for SlackSocket is available on GitHub and, as always, we welcome any contributions or feature requests!
About the author
Bradley Cicenas is a New York City-based infrastructure engineer with an affinity for microservices, systems design, data science, and stoops.

 United States
 Great Britain
 India
India
 Germany
 France
 Canada
 Russia
 Spain
Spain
 Brazil
 Australia
 Singapore
 Canary Islands
 Hungary
 Ukraine
 Luxembourg
 Estonia
 Lithuania
 South Korea
 Turkey
 Switzerland
 Colombia
 Taiwan
 Chile
Chile
 Norway
 Ecuador
 Indonesia
 New Zealand
 Cyprus
 Denmark
 Finland
 Poland
 Malta
Malta
 Czechia
 Austria
 Sweden
 Italy
Italy
 Egypt
Egypt
 Belgium
 Portugal
 Slovenia
 Ireland
 Romania
 Greece
 Argentina
 Netherlands
 Bulgaria
 Latvia
 South Africa
 Malaysia
 Japan
Japan
 Slovakia
 Philippines
 Mexico
 Thailand