


A view in vRealize Operations manager consists of the view type, subject, and data components:

In this tutorial, the view is a trend view, which gets its data from the CPU Demand (%) metric. The subject is the object type, which a view is associated with.
A view presents the data of the subject. For example, if the selected object is a host and you select the view named Host CPU Demand (%) Trend View, the result is a trend of the host’s CPU demand over a period of time.
Today we will walk through the parts needed to define and build custom views in vRealize Operations manager, and learn to apply them to real work situations.
Adding Name and description fields
Although it might seem obvious, the first thing you need to define when creating a report is the name and description. Before you dismiss this requirement and simply enter My View or Scott's Test, the name and description fields are very useful in defining the scope and target of the view. This is because many views are not really designed to be run/applied on the subject, but rather on one of its parents. This is especially true for lists and distributions, which we will cover below:
What are different View types
The presentation is the format the view is created in and how the information is displayed.
The following types of views are available:
- List: A list view provides tabular data about specific objects in the environment that correspond to the selected view.
- Summary: A summary view presents tabular information about the current use of resources in the environment.
- Trend: A trend view uses historic data to generate trends and forecasts for resource use and availability in the environment.
- Distribution: A distribution view provides aggregated data about resource distribution in the monitored environment. Pie charts or bar charts are used to present the data.
- Text: A text view displays text that you provide when you create the view.
- Image: An image view allows you to insert a static image.
List
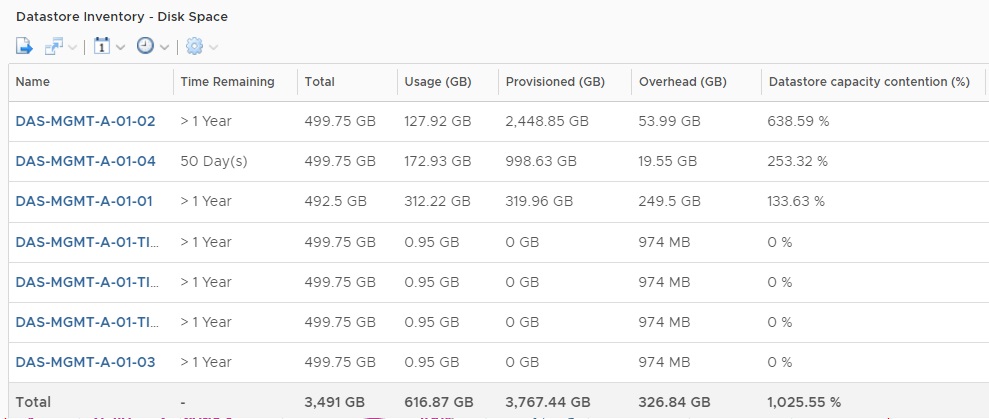
A list is one of the simplest presentation types to use and understand, and at the same time, is one of the most useful. A list provides a tabular layout of values for each data type, with the ability to provide an aggregation row such as sum or average at the end. Lists are the most useful presentation type for a large number of objects, and are able to provide information in the form of metrics and/or properties. Lists are also the most commonly used presentation when showing a collection of objects relative to its parent. An example of a list can be found in the following screenshot:
List summary
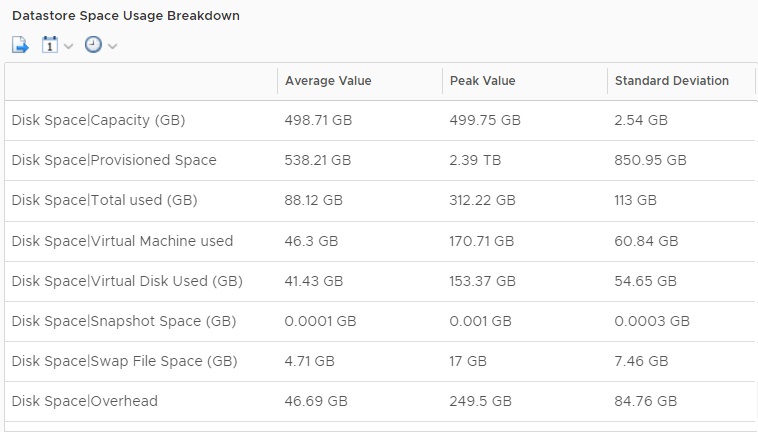
A summary is similar to a list, however the rows are the data types (rather than the objects) and the columns are aggregated values of all children of that subject type. Unlike a list, a summary field is compulsory, as the individual objects are not presented in the view. The summary view type is probably the least commonly used, but it is useful when you simply care about the end result and not the detail of how it was calculated.
The following example shows Datastore Space Usage from the cluster level; information such as the average used GB across each Datastore can be displayed without the need to show each Datastore present in a list:
Although it will be discussed in more detail in the next chapter, the availability of creating simple summary views of child resources has partially removed the need for creating super metrics for simply rolling up data to parent objects.
Trend
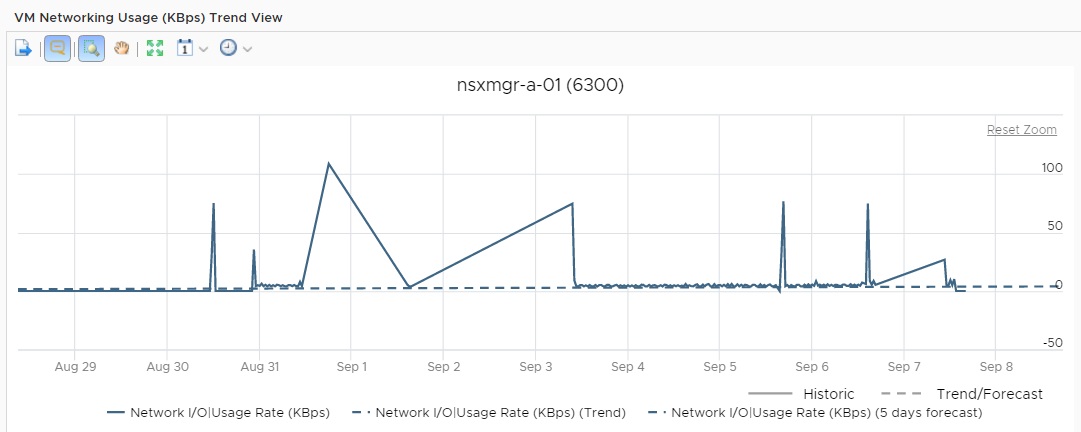
A trend view is a line graph representation of metrics showing historical data that can be used to generate trends and forecasts. Unlike some of the other presentation types, a trend can only show data from that subject type. As such, trend views do not filter up to parent objects.
A trend view, in many ways, is similar to a standard metric chart widget with a set of combined preconfigured data types, with one major exception. The trend view has the ability to forecast data into the future for a specified period of time, as well as show the trend line for historical data for any object type.
This allows the trend view to provide detailed and useful capacity planning data for any object in the vRealize Operations inventory. When selecting the data types to use in the view, it is recommended that, if multiple data types are used, that they support the same unit of measurement. Although this is not a requirement, views that have different unit types on the same scale are relatively hard to compare. An example of a trend view is shown as follows:
Distribution
A distribution view is a graphical representation of aggregated data which shows how resources fall within those aggregation groups. This essentially means that vRealize Operations finds a way of graphically representing a particular metric or property for a group of objects.
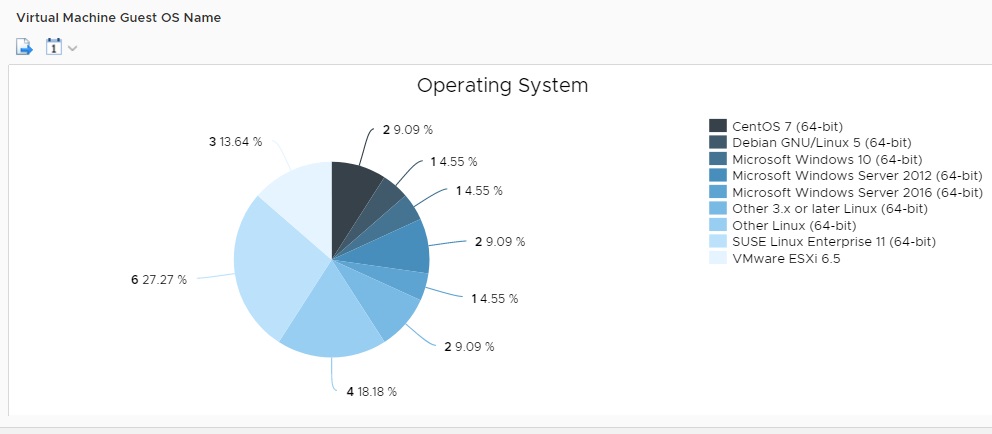
In this example, it is the distribution of VM OS types in a given vSphere cluster. A distribution like a summary is very useful in displaying a small amount of information about a large number of objects.
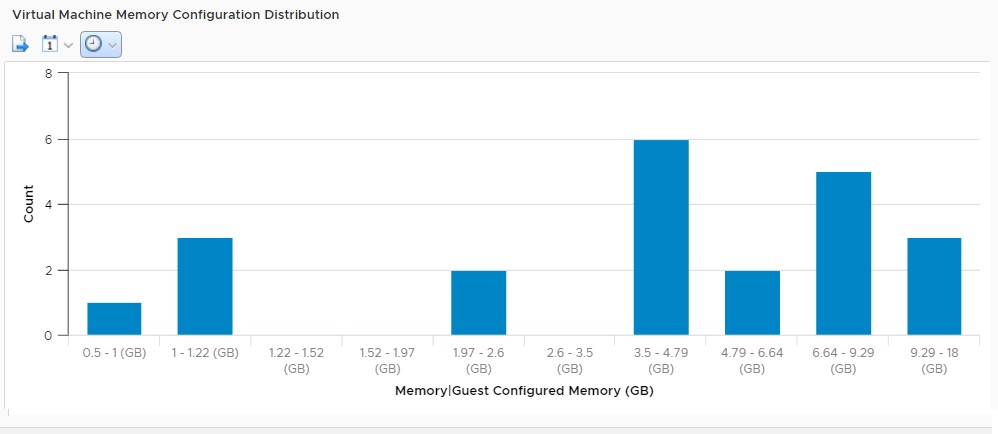
Distribution views can also be shown as bar charts. In this example, the distribution of Virtual Machine Memory Configuration Distribution is shown in a given vSphere cluster. This view can help spot virtual machines configured with a large amount of memory.
An important point when creating distribution views is that the subject must be a child of the preview or target object. This means that you can only see a view for the distribution on one of the subject’s parent objects.
Both visualization methods essentially group the subjects into buckets, with the number of buckets and their values based on the distribution type. The three distribution types are as follows:
- Dynamic distribution: vRealize Operations automatically determines how many buckets to create based on an interval, a min/max value, or a logarithmic equation. When dealing with varying data values, this is generally the recommended display.
- Manual distribution: Allows the administrator to manually set the range of each bucket in the display.
- Discrete distribution: Used for displaying exact values of objects rather than ranges. A discrete distribution is recommended if most objects only have a few possible values, such as properties or other binary values.
Text and images
The text and image views are used to insert static text or image content for the purpose of reports and dashboards. They allow an administrator to add context to a report in combination with the dynamic views that are inserted when the reports are generated.
Adding Subjects to View
Although the subjects are generally selected after the presentation, it makes sense to describe them first. The subject is the base object for which the view shows information. In other words, the subject is the object type that the data is coming from for the view. Any object type from any adapter can be selected. It is important to keep in mind that you may be designing a view for a parent object, however, the subject is actually the data of a child object. For example, if you wish to list all the Datastore free space in a vSphere Cluster itemized by Datastore, the subject will be a Datastore, not a Cluster Compute Resource. This is because although the list will always be viewed in the context of a cluster, the data listed is from Datastore objects themselves.
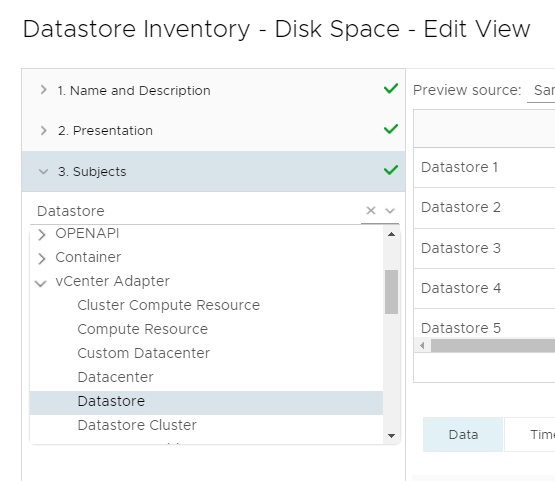
When selecting a subject, an option is provided to select multiple object types. If this is done, only data that is common to both types will be available.
Adding Data to View
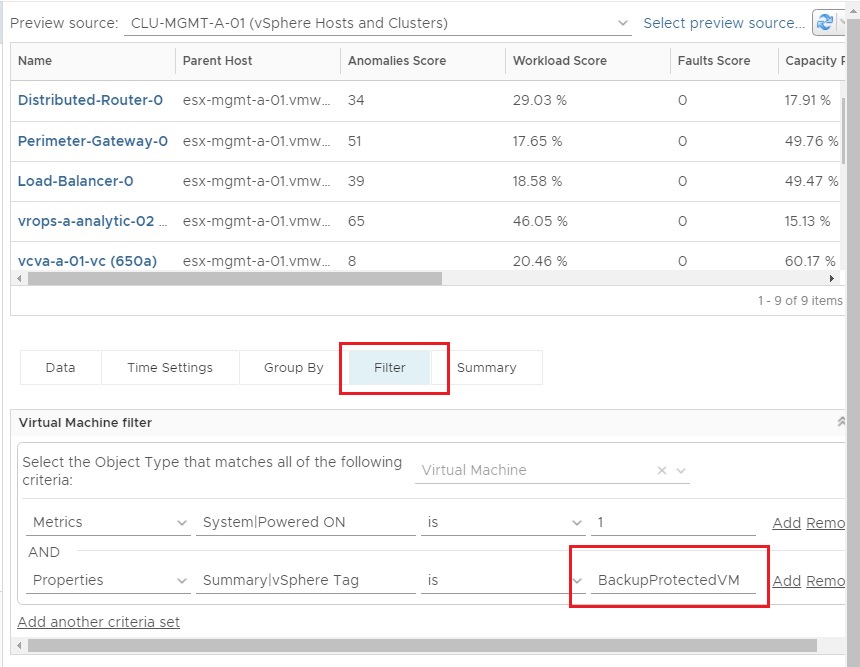
Data is the content that makes up the view based on the selected subject. The type of data that can be added and any additional options available depend on the select presentation type. An important feature with views is that they are able to display and filter based on properties, and not just standard metrics. This is particularly useful when filtering a list or distribution group. For example, the following screenshot shows badge information in a given vSphere Cluster, as long as they contain a vSphere tag of BackupProtectedVM. This allows a view to be filtered only to virtual machines that are deployed and managed by vRealize Automation:
Adding Visibility layer
One of the most useful features about views is that you have the ability to decide where they show up and where they can be linked from. The visibility layer defines where you can see a hyperlink to a view in vRealize Operations based on a series of checkboxes.
The visibility step is broken into three categories, which are Availability, Further Analysis, and Blacklist, as shown in the following screenshot:
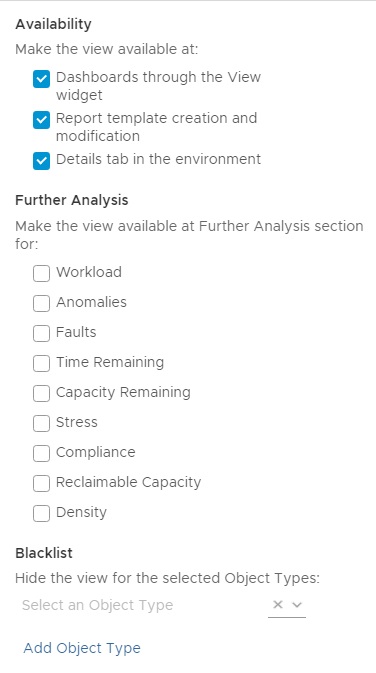
Availability
The availability checkboxes allow an administrator to devise how their view can be used and if there are cases where they wish to restrict its availability:
- Dashboard through the view widget: The view widget allows any created view to be displayed on a dashboard. This essentially allows an unlimited amount of data types to be displayed on the classic dashboards, with the flexibility of the different presentation types.
- Report template creation and modification: This setting allows views to be used in reports. If you are creating views explicitly to use in reports, ensure this box is checked.
- Details tab in the environment: The Details tab in the environment is the default location where administrators will use views. It is also the location where the Further Analysis links will take an administrator if selected. In most cases, it is recommended that this option be enabled, unless a view is not yet ready to be released to other users.
Further Analysis
The Further Analysis checkbox is a feature that allows an administrator to link views that they have created to the minor badges in the Object Analysis tab. Although this feature may seem comparatively small, it allows users to create relevant views for certain troubleshooting scenarios and link them directly to where administrators will be working. This allows administrators to leverage views more quickly for troubleshooting rather than simply jumping to the All Metrics tab and looking for dynamic threshold breaches.
Blacklist
The blacklist allows administrators to ensure that views cannot be used against certain object types. This is useful if you want to ensure that a view is only partially promoted up to a parent and not, for example, to a grandparent.
How to Delete a View
Views show up in multiple places. When you’re tempted to delete a view, ask yourself: Do I want to delete this entire view, or do I just want to no longer show it in one part of the UI?
Don’t delete a view when you just want to hide it in one part of the UI. When you delete a view, areas in the UI that use the view are adjusted:
- Report templates: The view is removed from the report template
- Dashboards: The view widget displays the message The view does not exist
- Further Analysis panel of badges on the Analysis tab: The link to the view is removed
- Details > Views tab for the selected object: The view is removed from the list
vRealize Operations will display a message informing you that deleting the view will modify the report templates that are using the view.
Now, you have learned the new powerful features available in views and the different view presentation types. To know more about handling alerts and notifications in vRealize Operations, check out this book Mastering vRealize Operations Manager – Second Edition.
Read Next:
VMware Kubernetes Engine (VKE) launched to offer Kubernetes-as-a-Service
Introducing VMware Integrated OpenStack (VIO) 5.0, a new Infrastructure-as-a-Service (IaaS) cloud


