How BAM differs from traditional business intelligence
The Oracle SOA Suite stores the state of all processes in a database in documented schemas so why do we need yet another reporting tool to provide insight into our processes and services? In other words how does BAM differ from traditional BI (Business Intelligence)? In traditional BI, reports are generated and delivered either on a scheduled basis or in response to a user request. Any changes to the information will not be reflected until the next scheduled run or until a user requests the report to be rerun. BAM is an event-driven reporting tool that generates alerts and reports in real time, based on a continuously changing data stream, some of whose data may not be in the database. As events occur in the Services and Processes, the business has defined they are captured by BAM and reports and views are updated in real time. Where necessary these updated reports are delivered to users. This delivery to users can take several forms. The best known is the dashboard on users' desktops that will automatically update without any need for the user to refresh the screen. There are also other means to deliver reports to the end user, including sending them via a text message or an email.
Traditional reporting tools such as Oracle Reports and Oracle Discoverer as well as Oracles latest Business Intelligence Suite can be used to provide some real-time reporting needs but they do not provide the event driven reporting that gives the business a continuously updating view of the current business situation.
Event Driven Architecture
Event Driven Architecture (EDA) is about building business solutions around responsiveness to events. Events may be simple triggers such as a stock out event or they may be more complex triggers such as the calculations to realize that a stock out will occur in three days. An Event Driven Architecture will often take a number of simple events and then combine them through a complex event processing sequence to generate complex events that could not have been raised without aggregation of several simpler events.
Oracle BAM scenarios
Oracle Business Activity Monitoring is typically used to monitor two distinct types of real-time data. Firstly it may be used to monitor the overall state of processes in the business. For example it may be used to track how many auctions are currently running, how many have bids on them, and how many have completed in the last 24 hours (or other time periods). Secondly it may be used to track in real-time Key Performance Indicators or KPIS. For example it may be used to provide a real-time updating dashboard to a seller to show the current total value of all the sellers' auctions and to track this against an expected target.
In the first case, we are interested in how business processes are progressing and are using BAM to identify bottlenecks and failure points within those processes. Bottlenecks can be identified by too much time being spent on given steps in the process. BAM allows us to compute the time taken between two points in a process, such as the time between order placement and shipping, and provide real-time feedback on those times. Similarly BAM can be used to track the percentage drop-out rate between steps in a sales process, allowing the business to take appropriate action.
In the second case, our interest is on some aggregate number, such as our total liabilities should we win all the auctions we are bidding on. This requires us to aggregate results from many events, possibly performing some kind of calculation on them to provide us with a single KPI that gives an indication to the business of how things are going. BAM allows us to continuously update this number in real on a dashboard without the need for continued polling. It also allows us to trigger alerts, perhaps through email or SMS, to notify an individual, when a threshold is breached.
In both cases reports delivered can be customized based on the individual receiving the report.
BAM architecture
It may seem odd to have a section on architecture in the middle of a article about how to effectively use BAM, but key to successful utilization of BAM is an understanding of how the different tiers relate to each other.
Logical view
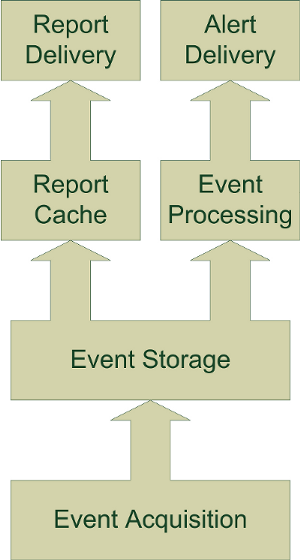
The following diagram represents a logical view of how BAM operates. Events are acquired from one or more sources through event acquisition and then normalized, correlated, and stored in event storage (generally a memory area in BAM that is backed up to disc). The report cache generates reports based on events in storage and then delivers those reports, together with real-time updates through the report delivery layer. Event processing is also performed on events in storage, and when defined conditions are met, alerts will be delivered through the alert delivery service.
Physical view
To better understand the physical view of the architecture of BAM, we have divided this section into four parts. Let us discuss these in detail.
Capture
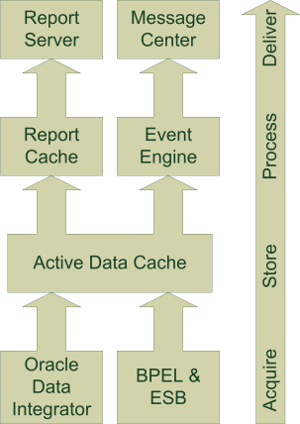
This logical view maps onto the physical BAM components shown in the following diagram. Data acquisition in the SOA Suite is handled by sensors in BPEL and ESB. BAM can also receive events from JMS message queues and access data in databases (useful for historical comparison). For complex data formats or for other data sources then Oracle Data Integrator (ODI is a separate product to the SOA Suite) is recommended by Oracle. Although potentially less efficient and more work than running ODI, it is also possible to use adapters to acquire data from multiple sources and feed it into BAM through ESB or BPEL.
At the data capture level we need to think of the data items that we can provide to feed the reports and alerts that we desire to generate. We must consider the sources of that data and the best way to load it into BAM.
Store
Once the data is captured, it is then stored in a normalized form in the Active Data Cache (ADC). This storage facility has the ability to do simple correlation based on fields within the data, and multiple data items received from the acquisition layer may update just a single object in the data cache. For example the state of a given BPEL process instance may be represented by a single object in the ADC and all updates to that process state will just update that single data item rather than creating multiple data items.
Process
Reports are run based on user demand. Once a report is run it will update the user's screen on a real time basis. Where multiple users are accessing the same report only one instance of the report is maintained by the report server. As events are captured and stored in real time the report engine will continuously monitor them for any changes that need to be made to those reports which are currently active. When changes are detected that impact active reports, then the appropriate report will be updated in memory and the updates sent to the user screen.
In addition to the event processing required to correctly insert and update items in the ADC, there is also a requirement to monitor items in the ADC for events that require some sort of action to be taken. This is the job of the event processor. This will monitor data in the ADC to see if registered thresholds on values have been exceeded or if certain time-outs have expired. The event processor will often need to perform calculations across multiple data items to do this.
Deliver
Delivery of reports takes place in two ways. First, users request reports to be delivered to their desktop by selecting views within BAM. These reports are delivered as HTML pages within a browser and are updated whenever the underlying data used in the report changes. The second approach is that reports are sent out as a result of events being triggered by the Event Processing Engine. In the latter case, the report may be delivered by email, SMS, or voice messaging using the notifications service. A final option available for these event generated reports is to invoke a web service to take some sort of automated action.
Closing the loop
While monitoring what is happening is all very laudable, it is only of benefit if we actually do something about what we are monitoring. BAM provides the real-time monitoring ability very well but it also provides the facility to invoke other services to respond to undesirable events such as stock outs. The ability to invoke external services is crucial to the concept of a closed loop control environment where as a result of monitoring we are able to reach back into the processes and either alter their execution or start new ones. For example when a stock out or low stock event is raised then the message centre could invoke a web service requesting a supplier to send more stock to replenish inventory. Placing this kind of feedback mechanism in BAM allows us to trigger events across multiple applications and locations in a way that may not be possible within a single application or process. For example, in response to a stock out, instead of requesting our supplier to provide more stock, we may be monitoring stock levels in independent systems and, based on stock levels elsewhere, may redirect stock from one location to another.
BAM platform anomaly
In 10g SOA Suite, BAM runs only as a Windows application. Unlike the rest of SOA Suite, it does not run on a JEE Application Server and it can only run on the Windows platform. In the next release, 11g, BAM will be provided as a JEE application that can run on a number of application servers and operating systems.
User interface
Development in Oracle BAM is done through a web-based user interface.
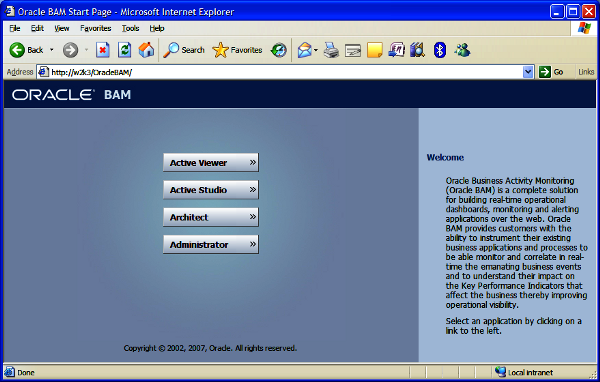
This user interface gives access to four different applications that allow you to interact with different parts of BAM. These are:
- Active Viewer for giving access to reports; this relates to the deliver stage for user requested reports.
- Active Studio for building reports; this relates to the 'process' stage for creating reports.
- Architect for setting up both inbound and outbound events. Data elements are defined here as data sources. Alerts are also configured here. This covers setting up, acquire and store stages as well as the deliver stage for alerts.
- Administrator for managing users and roles as well as defining the types of message sources.
We will not examine the applications individually but will take a task-focused look at how to use them as part of providing some specific reports.
Monitoring process state
Now that we have examined how BAM is constructed, let us use this knowledge to construct some simple dashboards that track the state of a business process. We will instrument a simple version of an auction process. The process is shown in the following figure:
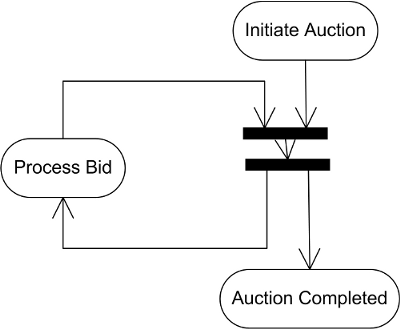
An auction is started and then bids are placed until the time runs out at which point the auction is completed. This is modelled in BPEL. This process has three distinct states:
- Started
- Bid received
- Completed
We are interested in the number of auctions in each state as well as the total value of auctions in progress. One needs to follow these steps to build the dashboard:
- Define our data within the Active Data Cache
- Create sensors in BPEL and map to data in the ADC
- Create suitable reports
- Run the reports
Defining data objects
Data in BAM is stored in data objects. Individual data objects contain the information that is reported in BAM dashboards and may be updated by multiple events. Generally BAM will report against aggregations of objects, but there is also the ability for reports to drill down into individual data objects.
Before defining our data objects let's group them into an Auction folder so they are easy to find. To do this we use the BAM Architect application and select Data Objects which gives us the following screen:
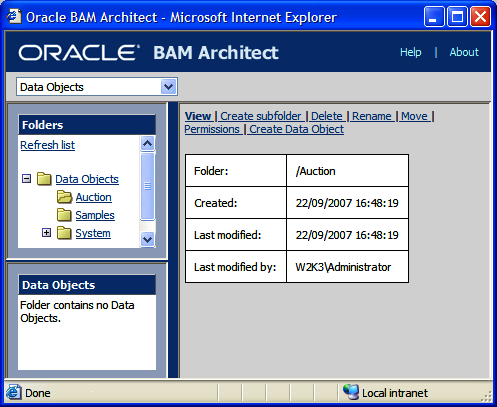
We select Create subfolder to create the folder and give it a name Auction.
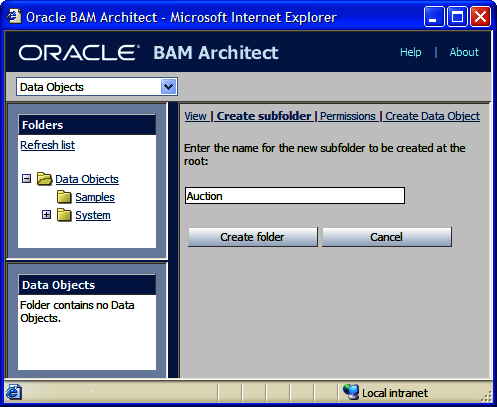
We then select Create folder to actually create the folder and we get a confirmation message to tell us that the folder was created. Notice that once created, the folder also appears in the Folders window on the left-hand side of the screen.
Now we have our folder we can create a data object. Again we select Data Objects from the drop-down menu. To define the data objects that are to be stored in our Active Data Cache, we open the Auction folder if it is not already open and selectCreate Data Object. If we don't select the Auction folder then we pick it later when filling in the details of the data object.
We need to give our object a unique name within the folder and optionally provide it with a tip text that helps explain what the object does when the mouse is moved over it in object listings. Having named our object we can now create the data fields by selecting Add a field. When adding fields we need to provide a name and type as well as indicating if they must contain data; the default Nullable does not require a field to be populated. We may also optionally indicate if a field should be public "available for display" and what if any tool tip text it should have.
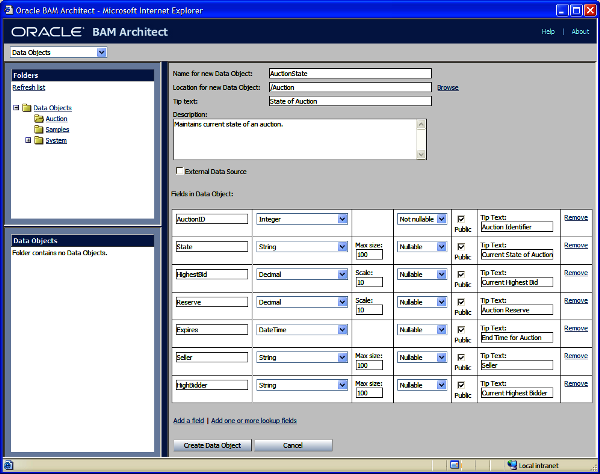
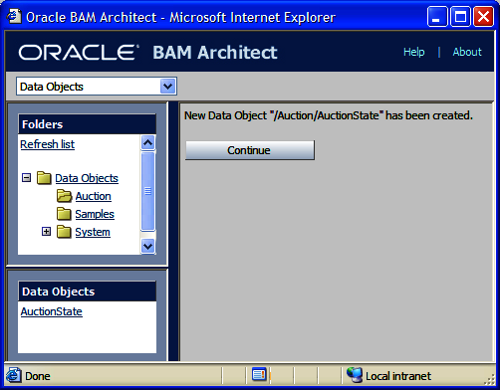
Once all the data fields have been defined then we can click Create Data Object to actually create the object as we have defined it. We are then presented with a confirmation screen that the object has been created.
Unlock access to the largest independent learning library in Tech for FREE!
Get unlimited access to 7500+ expert-authored eBooks and video courses covering every tech area you can think of.
Renews at $19.99/month. Cancel anytime
Grouping data into hierarchies
When creating a data object it is possible to specify Dimensions for the object. A dimension is based on one or more fields within the object. A given field can only participate in one dimension. This gives the ability to group the object by the fields in the given dimension. If multiple fields are selected for a single dimension then they can be layered into a hierarchy, for example to allow analysis by country, region, and city. In this case all three elements would be selected into a single dimension, perhaps called geography. Within geography a hierarchy could be set up with country at the top, region next, and finally city at the bottom, allowing drill down to occur in views. Just as a data object can have multiple dimensions, a dimension can also have multiple hierarchies.
A digression on populating data object fields
In the previous discussion, we mentioned the Nullable attribute that can be attached to fields. This is very important as we do not expect to populate all or even most of the fields in a data object at one moment in time. Do not confuse data objects with the low level events that are used to populate them. Data objects in BAM do not have a one-to-one correspondence with the low level events that populate them. In our auction example there will be just one auction object for every auction. However there will be at least two and usually more messages for every auction; one message for the auction starting, another for the auction completing, and additional messages for each bid received. These messages will all populate or in some cases overwrite different parts of the auction data object. The table shows how the three messages populate different parts of the data object.
|
Message
|
Auction ID
|
State
|
Highest bid
|
Reserve
|
Expires
|
Seller
|
Highest bidder
|
|
Auction Started
|
Inserted
|
Inserted
|
Inserted
|
Inserted
|
Inserted
|
Inserted
|
|
|
Bid Received
|
|
Updated
|
Updated
|
|
|
|
Updated
|
|
Auction Finished
|
|
Updated
|
|
|
|
|
|
Summary
In this article we have explored how Business Activity Monitoring differs from and is complementary to more traditional Business Intelligence solutions such as Oracle Reports and Business Objects. We have explored how BAM can allow the business to monitor the state of business targets and Key Performance Indicators, such as the current most popular products in a retail environment or the current time taken to serve customers in a service environment.
 United States
 Great Britain
 India
India
 Germany
 France
 Canada
 Russia
 Spain
Spain
 Brazil
 Australia
 Singapore
 Canary Islands
 Hungary
 Ukraine
 Luxembourg
 Estonia
 Lithuania
 South Korea
 Turkey
 Switzerland
 Colombia
 Taiwan
 Chile
Chile
 Norway
 Ecuador
 Indonesia
 New Zealand
 Cyprus
 Denmark
 Finland
 Poland
 Malta
Malta
 Czechia
 Austria
 Sweden
 Italy
Italy
 Egypt
Egypt
 Belgium
 Portugal
 Slovenia
 Ireland
 Romania
 Greece
 Argentina
 Netherlands
 Bulgaria
 Latvia
 South Africa
 Malaysia
 Japan
Japan
 Slovakia
 Philippines
 Mexico
 Thailand


