In this article by Deepak Agarwal and Chhavi Aggarwal, authors of the book Microsoft Dynamics AX 2012 R3 Reporting Cookbook, we will cover the following topics:
- Grouping in a report
- Adding ranges to a report
- Deploying a report
- Creating a menu item for a report
- Creating a report using a query in Warehouse Management
(For more resources related to this topic, see here.)
Reports are a basic necessity for any business process, as they aid in making critical decisions by analyzing all the data together in a customized manner. Reports can be fetched in many types, such as ad-hoc, analytical, transactional, general statements, and many more by using images, pie charts, and many other graphical representations. These reports help the user to undertake required actions. Microsoft SQL Reporting Services (SSRS) is the basic primary reporting tool of Dynamics AX 2012 R2 and R3.
This article will help you to understand the development of SSRS reports in AX 2012 R3 by developing and designing reports using simple steps. These steps have further been detailed into simpler and smaller recipes. In this article, you will design a report using queries with simple formatting, and then deploy the report to the reporting server to make it available for the user. This is made easily accessible inside the rich client.
Reporting overview
Microsoft SQL Server Reporting Services (SSRS) is the most important feature of Dynamics AX 2012 R2 and R3 reporting. It is the best way to generate analytical, high user scale, transactional, and cost-effective reports. SSRS reports offer ease of customization of reports so that you can get what you want to see. SSRS provides a complete reporting platform that enables the development, design, deployment, and delivery of interactive reports. SSRS reports use Visual Studio (VS) to design and customize reports. They have extensive reporting capabilities and can easily be exported to Excel, Word, and PDF formats.
Dynamics AX 2012 has extensive reporting capabilities like Excel, Word, Power Pivot, Management Reporter, and most importantly, SSRS reports. While there are many methodologies to generate reports, SSRS remains the prominent way to generate analytical and transactional reports. SSRS reports were first seen integrated in AX 2009, and today, they have replaced the legacy reporting system in AX 2012.
SSRS reports can be developed using classes and queries. In this article, we will discuss query-based reports.
In query-based reports, a query is used as the data source to fetch the data from Dynamics AX 2012 R3. We add the grouping and ranges in the query to filter the data. We use the auto design reporting feature to create a report, which is then deployed to the reporting server. After deploying the report, a menu item is attached to the report in Dynamics AX R3 so that the user can display the report from AX R3.
Through the recipes in this article, we will build a vendor master report. This report will list all the vendors under each vendor group. It will use the query data source to fetch data from Dynamics AX and subsequently create an auto design-based report. So that this report can be accessed from a rich client, it will then be deployed to the reporting servicer and attached to a menu item in AX.
Here are some important links to get started with this article:
Before you install the Reporting Services extensions see https://technet.microsoft.com/en-us/library/ee355041.aspx.
Grouping in reports
Grouping means putting things into groups. Grouping data simplifies the structure of the report and makes it more readable. It also helps you to find details, if required.
We can group the data in the query as well as in the auto design node in Visual Studio. In this recipe, we will structure the report by grouping the VendorMaster report based on the VendorGroup to make the report more readable.
How to do it...
In this recipe, we will add fields under the grouping node of the dataset created earlier in Visual Studio. The fields that have been added in the grouping node will be added and shown automatically in the SSRS report.
- Go to Dataset and select the VendGroup field.
- Drag and drop it to the Groupings node under the VendorMaster auto design.
This will automatically create a new grouping node and add the VendGroup field to the group. Each grouping has a header row where even fields that don't belong to the group but need to be displayed in the grouped node can be added.
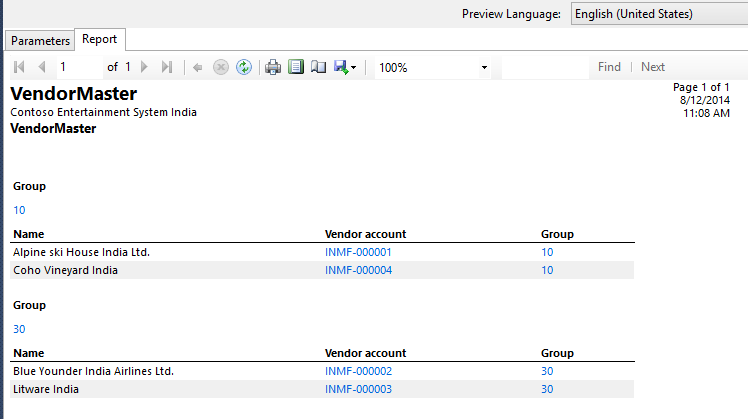
This groups the record and also acts like a header, as seen in the following screenshot:
How it works…
Grouping can also be done based on multiple fields. Use the row header to specify the fields that must be displayed in the header. A grouping can be added manually but dragging and dropping prevents a lot of tasks such as setting the row header.
Adding ranges to the report
Ranges are very important and useful while developing an SSRS report in AX 2012 R3. They help to show only limited data, which is filtered based on given ranges, in the report.
The user can filter the data in a report on the basis of the field added as a range. The range must be specified in the query. In this recipe, we will show how we can filter the data and use a query field as a range.
How to do it...
In this recipe, we will add the field under the Ranges node in the query that we made in the previous recipe. By adding the field as a range, you can now filter the data on the basis of VendGroup and show only the limited data in the report.
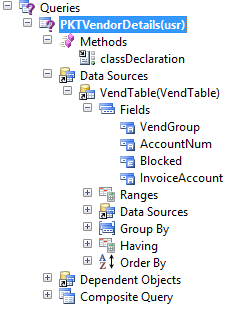
- Open the PKTVendorDetails query in AOT.
- Drag the VendGroup and Blocked fields to the Ranges node in AOT and save your query.

- In the Visual Studio project, right-click on Datasets and select Refresh.
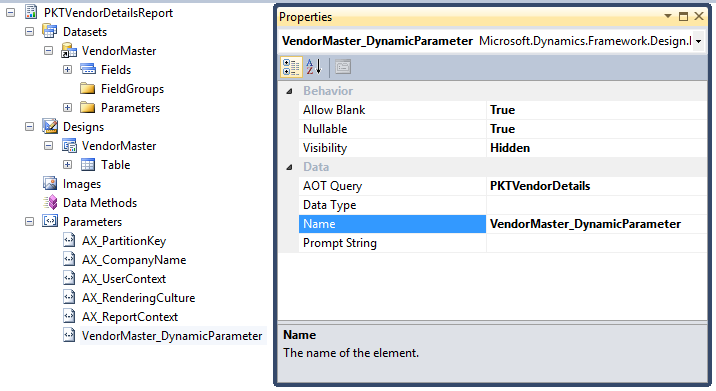
- Under the parameter node, VendorMaster_DynamicParameter collectively represents any parameter that will be added dynamically through the ranges. This parameter must be set to true to make additional ranges available during runtime. This adds a Select button to the report dialog, which the user can use to specify additional ranges other than what is added.
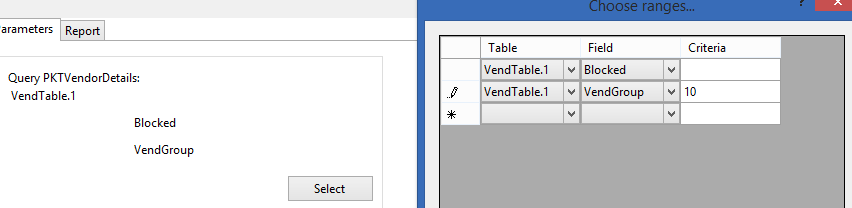
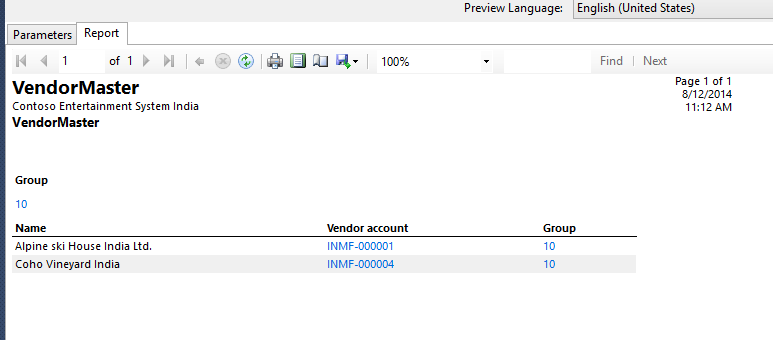
- Right-click on the VendorMaster auto design and select Preview. The preview should display the range that was added in the query. Click on the Select button and set the VendGroup value to 10. Click on the OK button, and then select the Report tab, as shown in the following screenshot:
- Save your changes and rebuild the report from Solution Explorer. Then, deploy the solution.
How it works…
The report dialog uses the query service UI builder to translate the ranges and to expose additional ranges through the query.
Dynamic parameter: The dynamic parameter unanimously represents all the parameters that are added at runtime. It adds the Select button to the dialog from where the user can invoke an advanced query filter window. From this filter window, more ranges and sorting can be added. The dynamic parameter is available per dataset and can be enabled or disabled by setting up the Dynamic Filters property to True or False.
The Report Wizard in AX 2012 still uses Morphx reports to auto-create reports using the wizard. The auto report option is available on every form that uses a new AX SSRS report.
Deploying a report
SSRS, being a server side solution, needs to deploy reports in Dynamics AX 2012 R3. Until the reports are deployed, the user will not be able to see them or the changes made in them, neither from Visual Studio nor from the Dynamics AX rich client.
Reports can be deployed in multiple ways and the developer must make this decision. In this recipe, we will show you how we can deploy reports using the following:
- Microsoft Dynamics AX R3
- Microsoft Visual Studio
- Microsoft PowerShell
Getting ready
In order to deploy reports, you must have the permission and rights to deploy them to SQL Reporting Services. You must also have the permission to access the reporting manager configuration.
Unlock access to the largest independent learning library in Tech for FREE!
Get unlimited access to 7500+ expert-authored eBooks and video courses covering every tech area you can think of.
Renews at $19.99/month. Cancel anytime
Before deploying reports using Microsoft PowerShell, you must ensure that Windows PowerShell 2.0 is installed.
How to do it...
Microsoft Dynamics AX R3 supports the following ways to deploy SSRS reports.
Location of deployment
For each of the following deployment locations, let's have a look at the steps that need to be followed:
- Microsoft Dynamics AX R3:
- Reports can be deployed individually from a developer workspace in Microsoft Dynamics AX.
- SSRS reports can be deployed by using the developer client in Microsoft Dynamics AX R3.
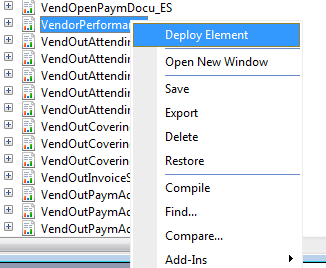
- In AOT, expand the SSRS Reports node, expand the Reports node, select the particular report that needs to be deployed, expand the selected report node, right-click on the report, and then select and click on Deploy Element.
- The developer can deploy as many reports as need to be deployed, but individually.
- Reports can be deployed for all the translated languages.
- Microsoft Visual Studio:
- Individual reports can be deployed using Visual Studio.
- Open Visual Studio. In Solution Explorer, right-click on the reporting project that contains the report that you want to deploy, and click on Deploy.

- The reports are deployed for the neutral (invariant) language only.
- Microsoft PowerShell:
- This is used to deploy the default reports that exist within Microsoft Dynamics AX R3.
- Open Windows PowerShell and by using this, you can deploy multiple reports at the same time.

- Visit http://msdn.microsoft.com/en-us/library/dd309703.aspx for details on how to deploy reports using PowerShell.
- To verify whether a report has been deployed, open the report manager in the browser and open the Dynamics AX folder. The PKTVendorDetails report should be found in the list of reports.
You can find the report manager URL from System administration | Setup | Business intelligence | Reporting Services | Report servers.
- The report can be previewed from Reporting Services also. Open Reporting Services and click on the name of the report to preview it.
How it works
Report deployment is the process of actually moving all the information related to a report to a central location, which is the server, from where it can be made available to the end user. The following list indicates the typical set of actions performed during deployment:
- The RDL file is copied to the server.
- The business logic is placed in the server location in the format of a DLL.
Deployment ensures that the RDL and business logic are cross-referenced to each other.
The Morphx IDE from AX 2009 is still available. Any custom reports that are designed can be imported. This support is only for the purpose of backward compatibility. In AX 2012 R3, there is no concept of Morphx reports.
Creating a menu item for a report
The final step of developing a report in AX 2012 R3 is creating a menu item inside AX to make it available for users to open from the UI end.
This recipe will tell you how to create a new menu item for a report and set the major properties for it. Also, it will teach you to add this menu item to a module to make it available for business users to access this report.
How to do it...
You can create the new menu item under the Menu Item node in AOT. In this recipe, the output menu item is created and linked with the menu item with SSRS report.
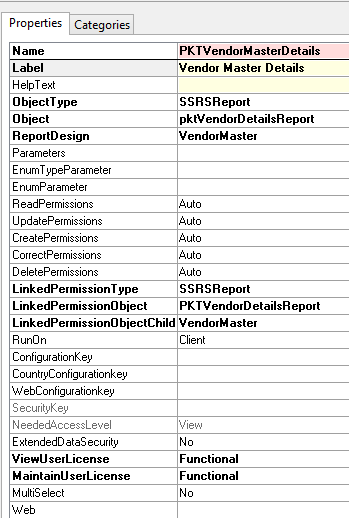
- Go to AOT | Menu Items | Output, right-click and select New Menu Item. Name it PKTVendorMasterDetails and set the properties as highlighted in the following screenshot:
- Open the Menu Item to run the report. A dialog appears with the Vendor hold and Group ranges added to the query, followed by a Select button. The Select button is similar to the Morphx reports option where the user can specify additional conditions. To disable the Select option, go to the Dynamic Filter property in the dataset of the query and set it to False.

The report output should appear as seen in the following screenshot:

How it works…
The report viewer in Dynamics AX is actually a form with an embedded browser control. The browser constructs the report URL at runtime and navigates to the reports URL. Unlike in AX 2009, when the report is rendering, the data it doesn't hold up using AX. Instead, the user can use the other parts of the application while the report is rendering. This is particularly beneficial for the end users as they can proceed with other tasks as the report executes.
The permission setup is important as it helps in controlling the access to a report. However, SSRS reports inherit user permission from the AX setup itself.
Creating a report using a query in Warehouse Management
In Dynamics AX 2012 R3, Warehouse Management is a new module. In the earlier version of AX (2012 or R2), there was a single module for Inventory and Warehouse Management. However, in AX R3, there is a separate module.
AX queries are the simplest and fastest way to create SSRS reports in Microsoft Dynamics AX R3. In this recipe, we will develop an SSRS report on Warehouse Management.
In AX R3, Warehouse Management is integrated with bar-coding devices such as RF-SMART, which supports purchase and receiving processes: picking, packing and shipping, transferring and stock counts, issuing materials for production orders, and reporting production as well. AX R3 also supports the workflow for the Warehouse Management module, which is used to optimize picking, packing, and loading of goods for delivery to customers.
Getting ready
To work through this recipe, Visual Studio must be installed on your system to design and deploy the report. You must have the permission to access all the rights of the reporting server, and reporting extensions must be installed.
How to do it...
Similar to other modules, Warehouse Management also has its tables with the "WHS" prefix. We start the recipe by creating a query, which consists of WHSRFMenuTable and WHSRFMenuLine as the data source. We will provide a range of Menus in the query. After creating a query, we will create an SSRS report in Visual Studio and use that query as the data source and will generate the report on warehouse management.
Open AOT, add a new query, and name it PKTWarehouseMobileDeviceMenuDetails.
- Add a WHSRFMenuTable table.
- Go to Fields and set the Dynamics property to Yes.
- Add a WHSRFMenuLine table and set the Relation property to Yes. This will create an auto relation that will inherit from table relation node.
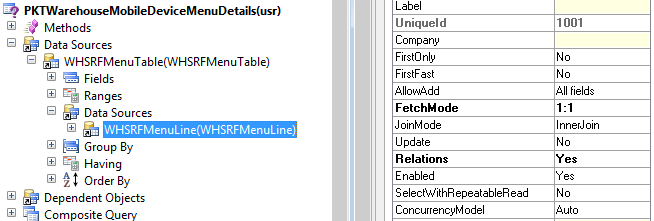
- Go to Fields and set the Dynamics property to Yes.
- Now open Visual Studio and add a new Dynamics AX report model project. Name it PKTWarehouseMobileDeviceMenuDetails.
- Add a new report to this project and name it PKTWarehouseMobileDeviceDetails.
- Add a new dataset and name it MobileDeviceDetails.
- Select the PKTWarehouseMobileDeviceMenuDetails query in the Dataset property.
- Select all fields from both tables. Click on OK.
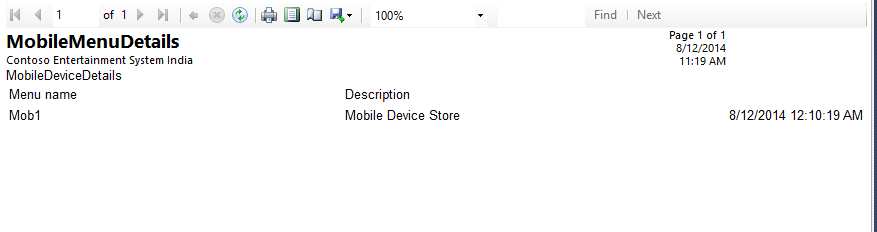
- Now drag and drop this dataset in the design node. It will automatically create an auto design. Rename it MobileMenuDetails.
- In the properties, set the layout property to ReportLayoutStyleTemplate.
- Now preview your report.
How it works
When we start creating an SSRS report, VS must be connected with Microsoft Dynamics AX R3. If the Microsoft Dynamics AX option is visible in Visual Studio while creating the new project, then the reporting extensions are installed. Otherwise, we need to install the reporting extensions properly.
Summary
This article helps you to walk through the basis of SSRS reports and create a simple report using queries. It will also help you understand the basic characteristics of reports.
Resources for Article:
Further resources on this subject:

 United States
 Great Britain
 India
India
 Germany
 France
 Canada
 Russia
 Spain
Spain
 Brazil
 Australia
 Singapore
 Canary Islands
 Hungary
 Ukraine
 Luxembourg
 Estonia
 Lithuania
 South Korea
 Turkey
 Switzerland
 Colombia
 Taiwan
 Chile
Chile
 Norway
 Ecuador
 Indonesia
 New Zealand
 Cyprus
 Denmark
 Finland
 Poland
 Malta
Malta
 Czechia
 Austria
 Sweden
 Italy
Italy
 Egypt
Egypt
 Belgium
 Portugal
 Slovenia
 Ireland
 Romania
 Greece
 Argentina
 Netherlands
 Bulgaria
 Latvia
 South Africa
 Malaysia
 Japan
Japan
 Slovakia
 Philippines
 Mexico
 Thailand


