


One of Wireshark’s strengths is its statistical tools. When using Wireshark, we have various types of tools, starting from the simple tools for listing end-nodes and conversations, to the more sophisticated tools such as flow and I/O graphs.
In this article, we will look at the simple tools in Wireshark that provide us with basic network statistics i.e; who talks to whom over the network, what are the chatty devices, what packet sizes run over the network, and so on.
To start statistics tools, start Wireshark, and choose Statistics from the main menu.
Using the statistics for capture file properties menu
In this recipe, we will learn how to get general information from the data that runs over the network. The capture file properties in Wireshark 2 replaces the summary menu in Wireshark 1.
Start Wireshark, click on Statistics.
How to do it…
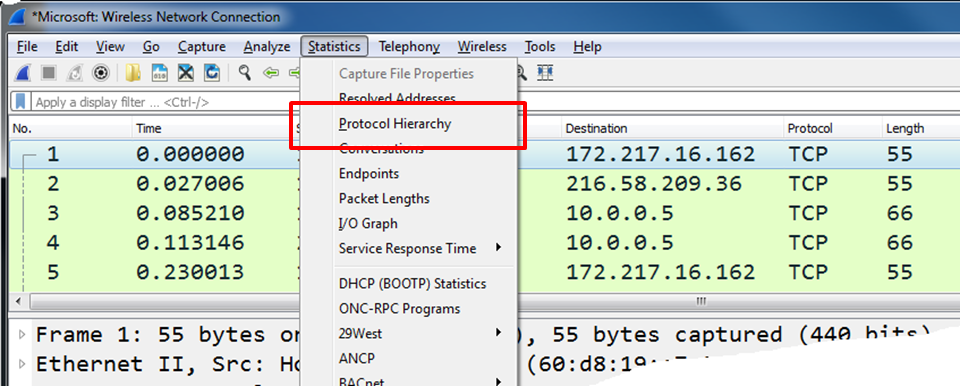
- From the Statistics menu, choose Capture File Properties:

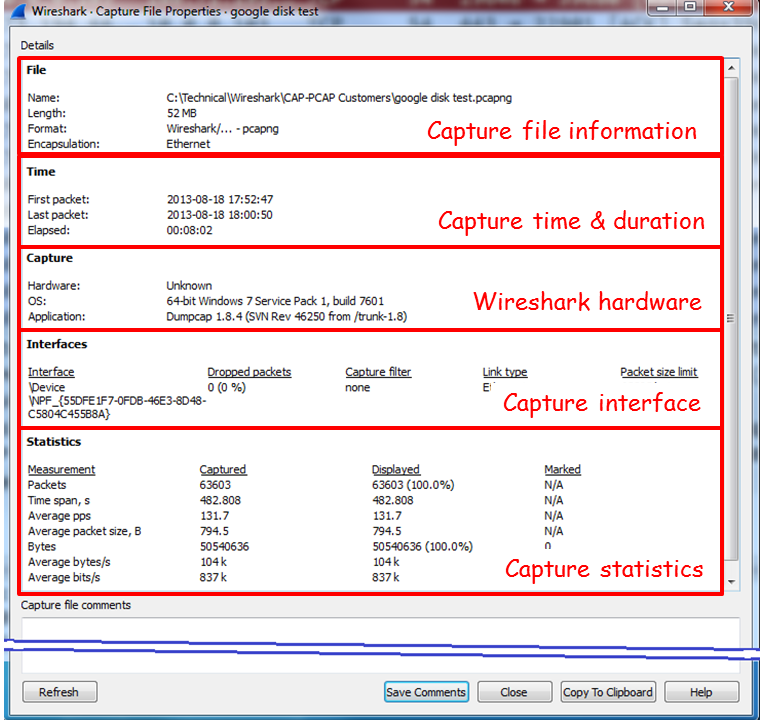
What you will get is the Capture File Properties window (displayed in the following screenshot).
- As you can see in the following screenshot, we have the following:
- File: Provides file data, such as filename and path, length, and so on
- Time: Start time, end time, and duration of capture
- Capture: Hardware information for the PC that Wireshark is installed on
- Interfaces: Interface information—the interface registry identifier on the left, if capture filter is turned on, interface type and packet size limit
- Statistics: General capture statistics, including captured and displayed packets:
How it works…
This menu simply gives a summary of the filtered data properties and the capture statistics (average packets or bytes per second) when someone wants to learn the capture statistics.
Using the statistics for protocol hierarchy menu
In this recipe, we will learn how to get protocol hierarchy information of the data that runs over the network.
Start Wireshark, click on Statistics.
How to do it…
- From the Statistics menu, choose Protocol Hierarchy:
What you will get is data about the protocol distribution in the captured file. You will get the protocol distribution of the captured data.
- The partial screenshot displayed here depicts the statistics of packets captured on a per-protocol basis:
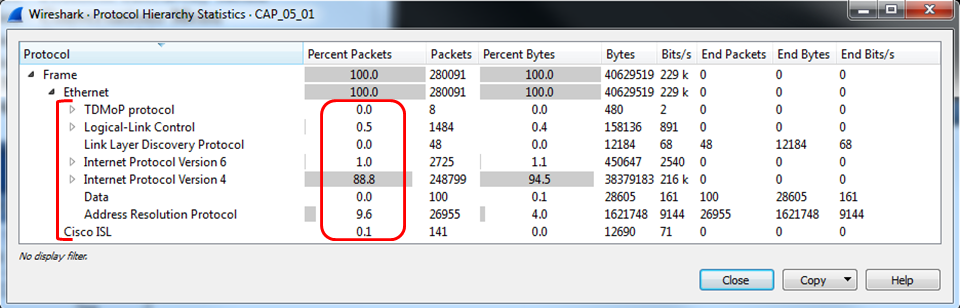
What you will get is the Protocol Hierarchy window:
- Protocol: The protocol name
- Percent Packets: The percentage of protocol packets from the total captured packets
- Packets: The number of protocol packets from the total captured packets
- Percent Bytes: The percentage of protocol bytes from the total captured packets
- Bytes: The number of protocol bytes from the total captured packets
- Bit/s: The bandwidth of this protocol, in relation to the capture time
- End Packets: The absolute number of packets of this protocol (for the highest protocol in the decode file)
- End Bytes: The absolute number of bytes of this protocol (for the highest protocol in the decode file)
- End Bit/s: The bandwidth of this protocol, relative to the capture packets and time (for the highest protocol in the decode file)
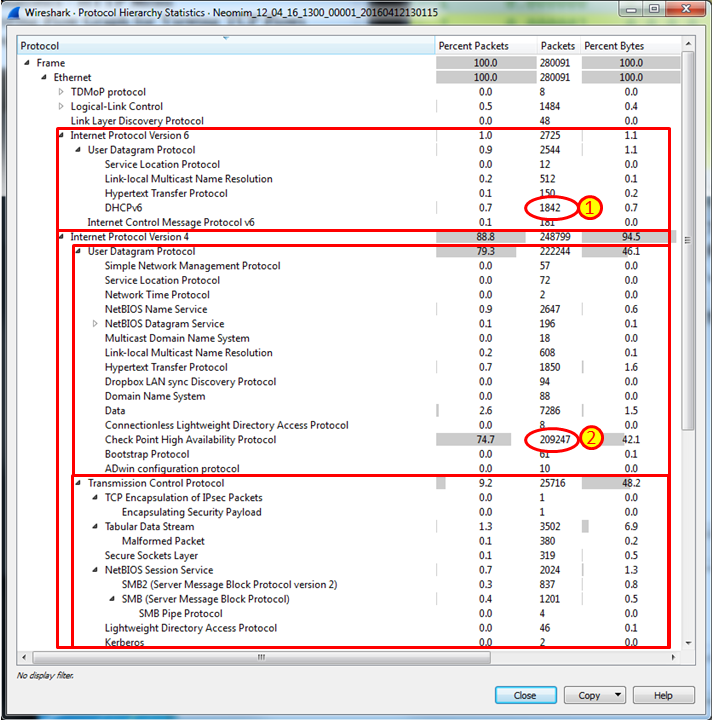
In this file example, we can see two interesting issues:
- We can see 1,842 packets of DHCPv6. If IPv6 and DHCPv6 are not required, disable it.
- We see more than 200,000 checkpoint high availability (CPHA) packets, 74.7% of which are sent over the network we monitored. These are synchronization packets that are sent between two firewalls working in a cluster, updating session tables between the firewalls. Such an amount of packets can severely influence performance. The solution for this problem is to configure a dedicated link between the firewalls so that session tables will not influence the network.
How it works…
Simply, it calculates statistics over the captured data. Some important things to notice:
- The percentage always refers to the same layer protocols. For example, in the following screenshot, we see that logical link control has 0.5% of the packets that run over Ethernet, IPv6 has 1.0%, IPv4 has 88.8% of the packets, ARP has 9.6% of the packets and even the old Cisco ISK has 0.1 %—a total of 100 % of the protocols over layer 2 Ethernet.
- On the other hand, we see that TCP has 75.70% of the data, and inside TCP, only 12.74% of the packets are HTTP, and that is almost it. This is because Wireshark counts only the packets with the HTTP headers. It doesn’t count, for example, the ACK packets, data packets, and so on:
Using the statistics for conversations menu
In this recipe, we will learn how to get conversation information of the data that runs over the network.
Start Wireshark, click on Statistics.
How to do it…
From the Statistics menu, choose Conversations:
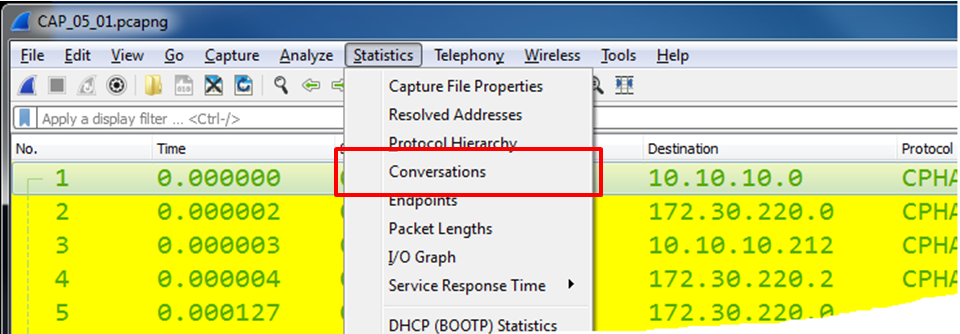
The following window will come up:

You can choose between layer 2 Ethernet statistics, layer 3 IP statistics, or layer 4 TCP or UDP statistics.
You can use this statistics tools for:
- On layer 2 (Ethernet): To find and isolate broadcast storms
- On layer 3/layer 4 (TCP/IP): To connect in parallel to the internet router port, and check who is loading the line to the ISP
If you see that there is a lot of traffic going out to port 80 (HTTP) on a specific IP address on the internet, you just have to copy the address to your browser and find the website that is most popular with your users.
If you don’t get anything, simply go to a standard DNS resolution website (search Google for DNS lookup) and find out what is loading your internet line.
For viewing IP addresses as names, you can check the Name resolution checkbox for name resolution (1 in the previous screenshot). For seeing the name resolution, you will first have to enable it by choosing View | Name Resolution | Enable for Network layer.
You can also limit the conversations statistics to a display filter by checking the Limit to display filter checkbox (2). In this way, statistics will be presented on all the packets passing the display filter.
A new feature in Wireshark version 2 is the graph feature, marked as (5) in the previous screenshot. When you choose a specific line in the TCP conversations statistics and click Graph…, it brings you to the TCP time/sequence (tcptrace) stream graph.
To copy table data, click on the Copy button (3). In TCP or UDP, you can mark a specific line, and then click on the Follow Stream… button (4). This will define a display filter that will show you the specific stream of data. As you can see in the following screenshot, you can also right-click a line and choose to prepare or apply a filter, or to colorize a data stream:

We also see that, unlike the previous Wireshark version, in which we saw all types of protocols in the upper tabs, here we can choose which protocols to see when only the identified protocols are presented by default.
How it works…
A network conversation is the traffic between two specific endpoints. For example, an IP conversation is all the traffic between two IP addresses, and TCP conversations present all TCP connections.
Using the statistics for endpoints menu
In this recipe, we will learn how to get endpoint statistics information of the captured data.
Start Wireshark and click on Statistics.
How to do it…
To view the endpoint statistics, follow these steps:
- From the Statistics menu, choose Endpoints:

- The following window will come up:

In this window, you will be able to see layer 2, 3, and 4 endpoints, which is Ethernet, IP, and TCP or UDP.
From the left-hand side of the window you can see (here is an example for the TCP tab):
- Endpoint IP address and port number on this host
- Total packets sent, and bytes received from and to this host
- Packets to the host (Packets A → B) and bytes to host (Bytes A → B)
- Packets to the host (Packets B → A) and bytes to host (Bytes B → A)
- The Latitude and Longitude columns applicable with the GeoIP configured
At the bottom of the window we have the following checkboxes:
- Name resolution: Provide name resolution in cases where it is configured in the name resolution under the view menu.
- Limit to display filter: To show statistics only for the display filter configured on the main window.
- Copy: Copy the list values to the clipboard in CSV or YAML format.
- Map: In cases where GeoIP is configured, shows the geographic information on the geographical map.
How it works…
Quite simply, it gives statistics on all the endpoints Wireshark has discovered. It can be any situation, such as the following:
- Few Ethernet (even on) end nodes (that is, MAC addresses), with many IP end nodes (that is, IP addresses)—this will be the case where, for example, we have a router that sends/receives packets from many remote devices.
- Few IP end nodes with many TCP end nodes—this will be the case for many TCP connections per host. Can be a regular operation of a server with many connections, and it could also be a kind of attack that comes through the network (SYN attack).
We learned about Wireshark’s basic statistic tools and how you can leverage those for network analysis. Get over 100 recipes to analyze and troubleshoot network problems using Wireshark 2 from this book Network Analysis using Wireshark 2 Cookbook – Second Edition.
Read Next:
Wireshark for analyzing issues & malicious emails in POP, IMAP, and SMTP [Tutorial]


