In this article by Prasad Kothari, the author of the book Data Analysis with STATA, the overall goal is to cover the STATA related topics such as data management, graphs and visualization and programming in STATA. The article will give a detailed description of STATA starting with an introduction to STATA and Data analytics and then talks about STATA programming and data management. After which it takes you through Data visualization and all the important statistical tests in STATA. Then the article will cover the Linear and the Logistics regression in STATA and in the end it will take you through few analyses like Survey analysis, Time Series analysis and Survival analysis in STATA. It also teaches different types of statistical modelling techniques and how to implement these techniques in STATA.
(For more resources related to this topic, see here.)
These days, many people use Stata for econometric and medical research purposes, among other things. There are many people who use different packages, such as Statistical Package for the Social Sciences (SPSS) and EViews, Micro, RATS/CATS (used by time series experts), and R for Matlab/Guass/Fortan (used for hardcore analysis). One should know the usage of Stata and then apply it in their relative fields. Stata is a command-driven language; there are over 500 different commands and menu options, and each has a particular syntax required to invoke any of the various options. Learning these commands is a time-consuming process, but it is not hard. At the end of each class, your do-file will contain all the commands that we have covered, but there is no way we will cover all of these commands in this short introductory course.
Stata is a combined statistical analytical tool that is intended for use by research scholars and analytics practitioners. Stata has many strengths, but we are going to talk about the most important one: managing, adjusting, and arranging large sets of data. Stata has many versions, and with every version, it keeps on improving; for example, in Stata versions 11 to 14, there are changes and progress in the computing speed, capabilities and functionalities, as well as flexible graphic capabilities. Over a period of time, Stata keeps on changing and updating the model as per users' suggestions. In short, the regression method is based on a nonstandard feature, which means that you can easily get help from the Web if another person has written a program that can be integrated with their software for the purpose of analysis. The following topics will be covered in this articler:
Introducing Data analytics
Introducing the Stata interface and basic techniques
Introducing data analytics
We analyze data everyday for various reasons. To predict an event or forecast the key indicators, such as the revenue for given organization, is fast becoming a major requirement in the industry. There are various types of techniques and tools that can be leveraged to analyze the data. Here are the techniques that will be covered in this article using Stata as a tool:
Stata Programming and Data management: Before predicting anything, we need to manage and massage the data in order to make it good enough to be something through which insights can be derived. The programming aspect helps in creating new variables to treat data in such a way that finding patterns in historical data or predicting the outcome of given event becomes much easier.
Data visualization: After the data preparation, we need to visualize the data for the the following:
To view what patterns in the data look like
To check whether there are any outliers in the data
To understand the data better
To draw preliminary insights from the data
Important statistical tests in Stata: After data visualization, based on observations, you can try to come up with various hypotheses about the data. We need to test these hypotheses on the datasets to check whether they are statistically significant and whether we can depend on and apply these hypotheses in future situations as well.
Linear regression in Stata: Once done with the hypothesis testing, there is always a business need to predict one of the variables, such as what the revenue of the financial organization will be given the specific conditions, and so on. These predictions about continuous variables, such as the revenue, the default amount on the credit card, and the number of items sold in a given store, come through linear regression. Linear regression is the most basic and widely used prediction methodology. We will go into details of linear regression in a later chapter.
Logistic regression in Stata: When you need to predict the outcome of a particular event along with the probability, logistic regression is the best and most acknowledged method by far. Predicting which team will win the match in football or cricket or predicting whether a customer will default on a loan payment can be decided through the probabilities given by logistic regression.
Survey analysis in Stata: Understanding the customer sentiment and consumer experience is one of the biggest requirements of the retail industry. The research industry also needs data about people's opinion in order to derive the effect of a certain event or the sentiments of the affected people. All of these can be achieved by conducting and analyzing survey datasets. Survey analysis can have various subtechniques, such as factor analysis, principle component analysis, panel data analysis, and so on.
Time series analysis in Stata: When you try to forecast a time-dependent variable with reasonable cyclic behavior of seasonality, time series analysis comes handy. There are many techniques of time series analysis, but we will talk about a couple of them: Autoregressive Integrated Moving Average (ARIMA) and Box Jenkins. Forecasting the amount of rainfall depending on the amount of rainfall in the past 5 years is a classic time series analysis problem.
Survival analysis in Stata: These days, lots of customers attrite from telecom plans, healthcare plans, and so on and join the competitors. When you need to develop a churn model or attrition model to check who will attrite, survival analysis is the best model.
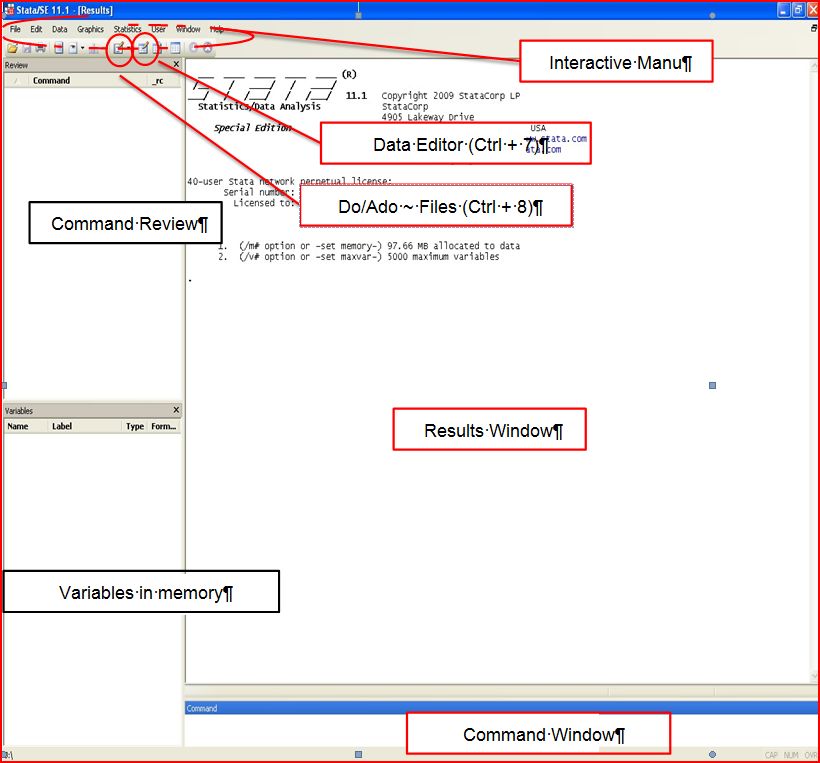
The Stata interface
Let's discuss the location and layout of Stata. It is very easy to locate Stata on a computer or laptop; after installing the software, go to the start menu, go to the search menu, and type Stata. You can find out the path where the file is saved. This depends on which version has been installed. Another way to find Stata on computer is through the quick launch button as well as through start programs.
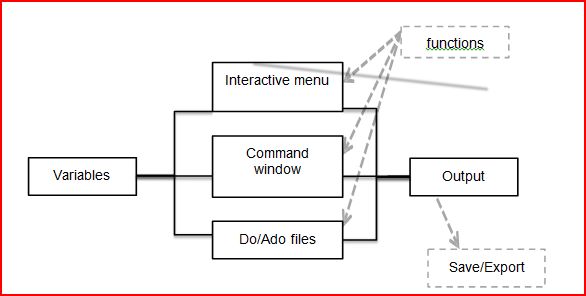
The preceding diagram represents the Stata layout. The four types of processors in Stata are multiprocessor (two or four), special edition processor (flavors), intercooled, and small processor. The multiprocessor is one of the most efficient processors. Though all processor versions function in a similar fashion, only variables' repressors frequency increases with each new version. At present, Stata version 11 is in demand and is being used on various computers. It is a type of software that runs on commands. In the new versions of Stata, new ways, such as menus that can search Stata, have come in the market; however, typing a command is the most simple and quick way to learn Stata. The more you leverage the functionality of typing the command, the better your learning is. Through the typing technique method, programming becomes easy and simple for analytics. Sometimes, it is difficult to find the exact syntax in commands; therefore, it is advisable that the menu command be used. Later on, you just copy the same command for further use. There are three ways to enter the commands, as follows:
Use the do-file program. This is a type of program in which one has to inform the computer (through a command) that it needs to use the do-file type.
Type the command manually through typing.
Enter the command interactively; just click on the menu screen.
Though all the three types discussed in the preceding bullets are used, the do-file type is the most frequently used one. The reason is that for a bigger file, it is faster as compared to manual typing. Secondly, it can store the data and keep it in the same format in which it was stored. Suppose you make a mistake and want to rectify it; what would you do? In this case, do-file is useful; one can correct it and run the program once again. Generally, an interactive command is used to find out the problem and later on, do-file is used to solve it. The following is an example of an interactive command:
Data-storing techniques in Stata
Stata is a multipurpose program, which can serve not only its own data, but also other data in a simple format, for example, ASCII. Regardless of the data type format (Excel/statistical package), it gets automatically exported to the ASCII file. This means that all the data can now easily be imported to Stata.
The data entered in Stata is in different types of variables, such as vectors with individual observations in every row; it also holds strings and numeric strings. Every row has a detailed observation of the individual, country, firm, or whatever information is entered in Stata.
As the data is stored in variables, it makes Stata the most efficient way to store information. Sometimes, it is better to save the data in a different storage form, such as the following:
Unlock access to the largest independent learning library in Tech for FREE!
Get unlimited access to 7500+ expert-authored eBooks and video courses covering every tech area you can think of.
Renews at $19.99/month. Cancel anytime
Matrices
Macros
Matrices should be used carefully as they consume more memory as compared to variables, so there might be a possibility of low space memory before work is started.
Another form is macros; these are similar to variables in other programming languages and are named containers, which means they contain information of any type. There are two flavors of macros: local/temporary and global. Global macros are flexible and easy to manage; once they are defined in a computer or laptop, they can be easily opened through all commands. On the other hand, local macros are temporary objects that are formed for a particular environment and cannot be use in another area. For example, if you use a local macro for do-file, that code will only exist in that particular environment.
Directories and folders in Stata
Stata has a tree-style structure to organize directories as well as folders similar to other operating systems, such as Windows, Linux, Unix, and Mac OS. This makes things easy and can be retrieved later on dates that are convenient. For example, the data folder is used to save entire datasets, subfolders for every single dataset, and so on. In Stata, the following commands can be leveraged:
Dos
Linux
Unix
For example, if you need to change the directory, you can use the CD command for example:
CD C:Stataforlder
You can also generate a new directory along with the current directory you have been using. For example:
mkdir "newstata".
You can leverage the dir command to get the details of the directory. If you need the current directory name along with the directory, you can utilize the pwd or cd command.
The use of paths in Stata depends on the type of data; usually, there are two paths: absolute and relative. The absolute path contains the full address, denoting the folder. In the command you have seen in the earlier example, we leveraged the CD command using the path that is absolute. On the contrary, the relative path provides us with the location of the file. The following example of mkdir has used the relative path:
mkdir "EStata|Stata1"
The use of the relative path will be beneficial, especially when working on different devices, such as a PC at home or a library or server. To separate folders, Windows and Dos use a backslash (), whereas Linux and Unix use a slash (/). Sometimes, these connotations might be troublesome when working on the server where Stata is installed. As a general rule, it is advisable that you use slashes in the relative path as Stata can easily understand slash as a separator. The following is an example of this:
mkdir "/Stata1/Data" – this is how you create the new folder for your
STATA work.
Summary
In this Article we discussed lots of basic commands, which can be leveraged while performing Stata programming. Read Data Analysis with Stata to gain detailed knowledge of the different data management techniques and programming in detail.
As you learn more about Stata, you will understand the various commands and functions and their business applications.

 United States
 Great Britain
 India
India
 Germany
 France
 Canada
 Russia
 Spain
Spain
 Brazil
 Australia
 Singapore
 Canary Islands
 Hungary
 Ukraine
 Luxembourg
 Estonia
 Lithuania
 South Korea
 Turkey
 Switzerland
 Colombia
 Taiwan
 Chile
Chile
 Norway
 Ecuador
 Indonesia
 New Zealand
 Cyprus
 Denmark
 Finland
 Poland
 Malta
Malta
 Czechia
 Austria
 Sweden
 Italy
Italy
 Egypt
Egypt
 Belgium
 Portugal
 Slovenia
 Ireland
 Romania
 Greece
 Argentina
 Netherlands
 Bulgaria
 Latvia
 South Africa
 Malaysia
 Japan
Japan
 Slovakia
 Philippines
 Mexico
 Thailand