In this article by Ron Vincent author of the book Learning ArcGIS Runtime SDK for .NET, we're going to learn about spatial analysis with ArcGIS Runtime. As with other parts of ArcGIS Runtime, we really need to understand how spatial analysis is set up and executed with ArcGIS Desktop/Pro and ArcGIS Server. As a result, we will first learn about spatial analysis within the context of geoprocessing. Geoprocessing is the workhorse of doing spatial analysis with Esri's technology. Geoprocessing is very similar to how you write code; in that you specify some input data, do some work on that input data, and then produce the desired output. The big difference is that you use tools that come with ArcGIS Desktop or Pro. In this article, we're going to learn how to use these tools, and how to specify their input, output, and other parameters from an ArcGIS Runtime app that goes well beyond what's available in the GeometryEngine tool. In summary, we're going to cover the following topics:
Introduction to spatial analysis
Introduction to geoprocessing
Preparing for geoprocessing
Using geoprocessing in runtime
Online geoprocessing
(For more resources related to this topic, see here.)
Introducing spatial analysis
Spatial analysis is a broad term that can mean many different things, depending on the kind of study to be undertaken, the tools to be used, and the methods of performing the analysis, and is even subject to the dynamics of the individuals involved in the analysis. In this section, we will look broadly at the kinds of analysis that are possible, so that you have some context as to what is possible with the ArcGIS platform. Spatial analysis can be divided into these five broad categories:
Point patterns
Surface analysis
Areal data
Interactivity
Networks
Point pattern analysis is the evaluation of the pattern or distribution of points in space. With ArcGIS, you can analyze point data using average nearest neighbor, central feature, mean center, and so on. For surface analysis, you can create surface models, and then analyze them using tools such as LOS, slope surfaces, viewsheds, and contours. With areal data (polygons), you can perform hotspot analysis, spatial autocorrelation, grouping analysis, and so on. When it comes to modeling interactivity, you can use tools in ArcGIS that allow you to do gravity modeling, location-allocation, and so on. Lastly, with Esri's technology you can analyze networks, such as finding the shortest path, generating drive-time polygons, origin-destination matrices, and many other examples.
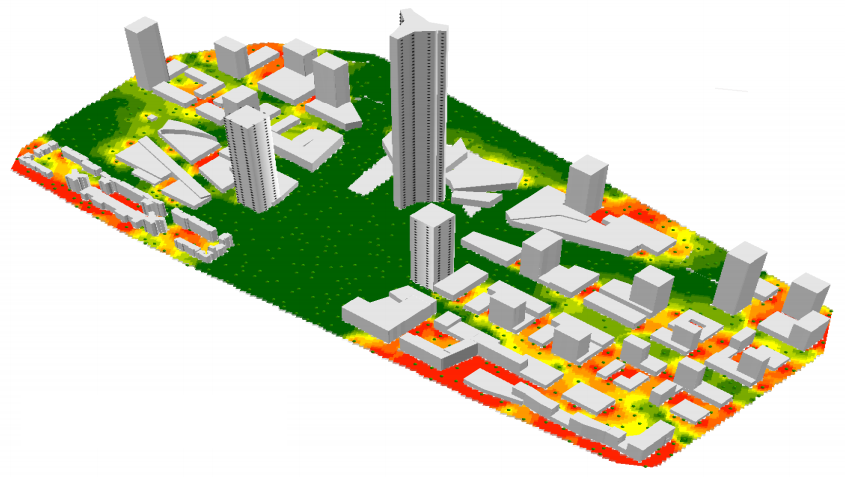
ArcGIS provides the ability to perform all of these kinds of analysis using a variety of tools. For example, here the areas in green are visible from the tallest building. Areas in red are not visible:
This article will deal with what is important to understand is that the ArcGIS platform has the capability to help solve problems such as these:
An epidemiologist collects data on a disease, such as Chronic Obstructive Pulmonary Disease (COPD), and wants to know where it occurs and whether there are any statistically significant clusters so that a mitigation plan can be developed
A mining geologist wants to obtain samples of a precious mineral so that he/she can estimate the overall concentration of the mineral
A military analyst or soldier wants to know where they can be located in the battlefield and not been seen
A crime analyst wants to know where crimes are concentrated so that they can increase police presence as a deterrent
A research scientist wants to develop a model to predict the path of a fire
There are many more examples. With ArcGIS Desktop and Pro, along with the correct extension, questions can be posed and answered using a variety of techniques. However, it's important to understand that ArcGIS Runtime may or may not be a good fit and may or may not support certain tools. In many cases, spatial analysis would be best studied with ArcGIS Desktop or Pro. For example, if you plan to conduct hotspot analysis on patients or crime, doing this kind of operation with Desktop or Pro is best suited because it's typically something you do once. On the other hand, if you plan to allow users to repeat this process again and again with different data, and you need high performance, building a tool with ArcGIS Runtime will be the perfect solution, especially if they need to run the tool in the field. It should also be noted that, in some cases, the ArcGIS JavaScript API will also be better suited.
Introducing geoprocessing
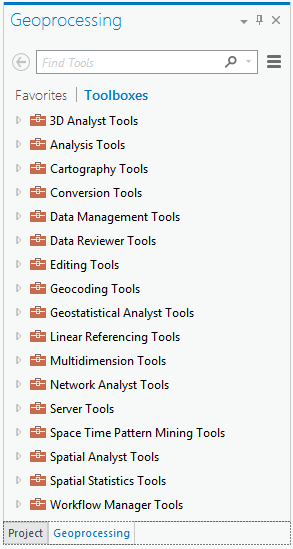
If you open up the Geoprocessing toolbox in ArcGIS Desktop or Pro, you will find dozens of tools categorized in the following manner:
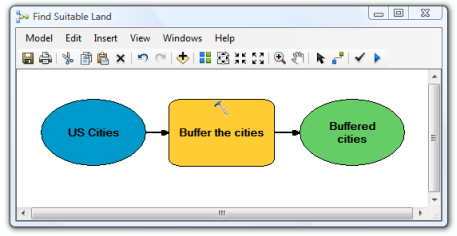
With these tools, you can build sophisticated models by using ModelBuilder or Python, and then publish them to ArcGIS Server. For example, to perform a buffer with the GeometryEngine tool, you would drag the Buffer tool onto the ModelBuilder canvas, as shown here, and specify its inputs and outputs:
This model specifies an input (US cities), performs an operation (Buffer the cities), and then produces an output (Buffered cities). Conceptually, this is programming except that the algorithm is built graphically instead of with code. You may be asking: Why would you use this tool in ArcGIS Desktop or Pro? Good question. Well, ArcGIS Runtime only comes with a few selected tools in GeometryEngine. These tools, such as the buffer method in GeometryEngine, are so common that Esri decided to include them with ArcGIS Runtime so that these kinds of operation could be performed on the client without having to call the server. On the other hand, in order to keep the core of ArcGIS Runtime lightweight, Esri wanted to provide these tools and many more, but make them available as tools that you need to call on when required for special or advanced analysis. As a result, if your app needs basic operations, GeometryEngine may provide what you need. On the other hand, if you need to perform more sophisticated operations, you will need to build the model with Desktop or Pro, published it to Server, and then consume the resulting service with ArcGIS Runtime. The rest of this article will show you how to consume a geoprocessing model using this pattern.
Preparing for geoprocessing
To perform geoprocessing, you will need to create a model with ModelBuilder and/or Python. For more details on how to create models using ModelBuilder, navigate to http://pro.arcgis.com/en/pro-app/help/analysis/geoprocessing/modelbuilder/what-is-modelbuilder-.htm.
To build a model with Python, navigate to http://pro.arcgis.com/en/pro-app/help/analysis/geoprocessing/basics/python-and-geoprocessing.htm.
Once you've created a model with ModelBuilder or Python, you will then need to run the tool to ensure that it works and to make it so that it can be published as a geoprocessing service for online use, or as a geoprocessing package for offline use. See here for publishing a service:
If you plan to use geoprocessing offline, you'll need to publish a geoprocessing package (*.gpk) file. You can learn more about these at https://desktop.arcgis.com/en/desktop/latest/analyze/sharing-workflows/a-quick-tour-of-geoprocessing-packages.htm.
Once you have a geoprocessing service or package, you can now consume it with ArcGIS Runtime. In the sections that follow, we will use classes from Esri.ArcGISRuntime.Tasks.Geoprocessing that allow us to consume these geoprocessing services or packages.
Online geoprocessing with ArcGIS Runtime
Once you have created a geoprocessing model, you will want to access it from ArcGIS Runtime. In this section, we're going to do surface analysis from an online service that Esri has published. To accomplish this, you will need to access the REST endpoint by typing in the following URL:
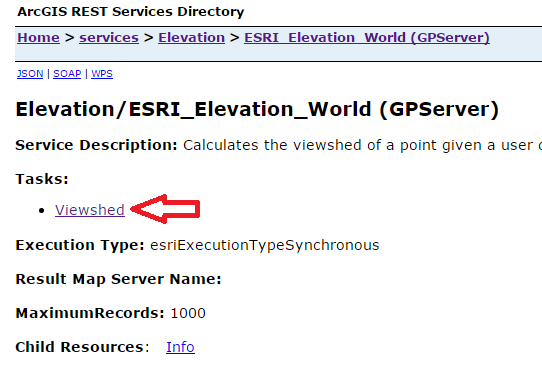
When you open this page, you'll notice the description and that it has a list of Tasks:
A task is a REST child resource of a geoprocessing service. A geoprocessing service can have one or more tasks associated with it. A task requires a set of inputs in the form of parameters. Once the task completes, it will produce some output that you will then use in your app. The output could be a map service, a single value, or even a report. This particular service only has one task associated with it and it is called Viewshed. If you click on the task called Viewshed, you'll be taken to this page: http://sampleserver6.arcgisonline.com/arcgis/rest/services/Elevation/ESRI_Elevation_World/GPServer/Viewshed.
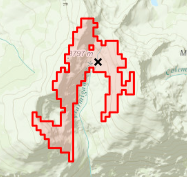
This service will produce a viewshed of where the user clicks that looks something like this:
The user clicks on the map (X) and the geoprocessing task produces a viewshed, which shows all the areas on the surface that are visible to an observer, as if they were standing on the surface.
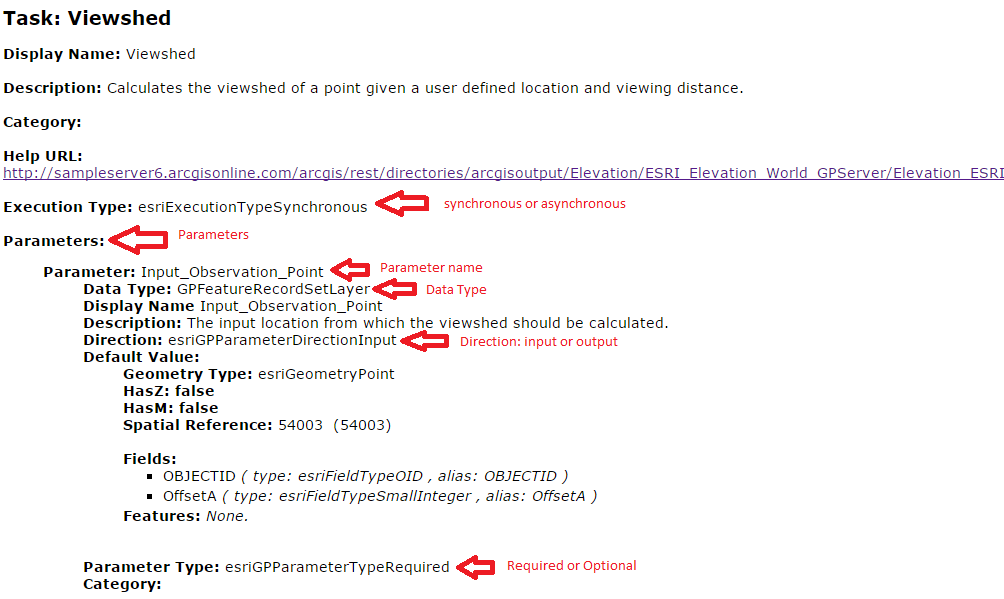
Once you click on the task, you'll note the concepts marked in the following screenshot:
As you can see, beside the red arrows, the geoprocessing service lets you know what is required for it to operate, so let's go over each of these:
First, the service lets you know that it is a synchronous geoprocessing service. A synchronous geoprocessing task will run synchronously until it has completed, and block the calling thread. An asynchronous geoprocessing task will run asynchronously, but it won't block the calling thread.
The next pieces of information you'll need to provide to the task are the parameters. In the preceding example, the task requires Input_Observation_Point. You will need to provide this exact name when providing the parameter later on, when we write the code to pass in this parameter.
Also, note that the Direction value is esriGPParameterDirectionInput. This tells you that the task expects that Input_Observation_Point is an input to the model.
Lastly, note that the Parameter Type value is Required. In other words, you must provide the task with this parameter in order for it to run.
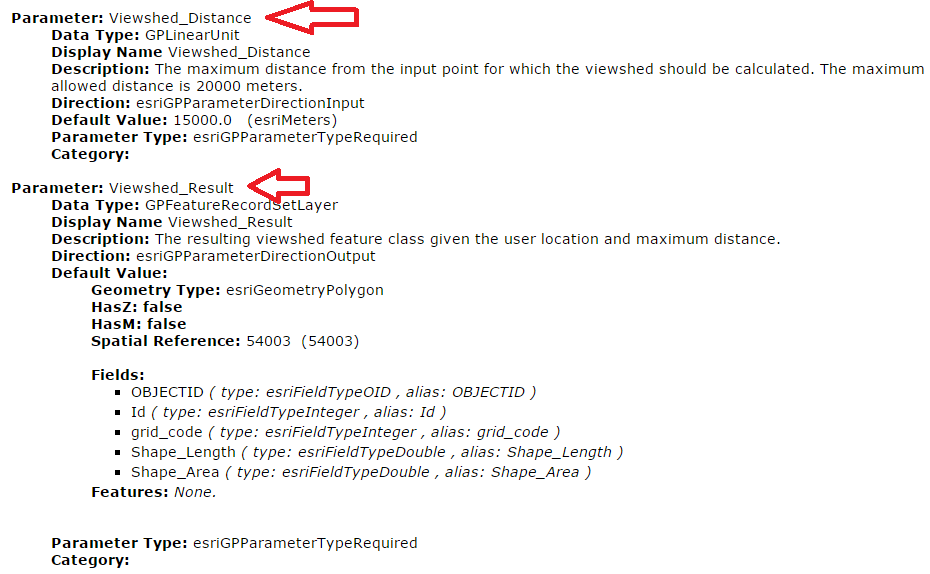
It's also worth noting that Default Value is an esriGeometryPoint type, which in ArcGIS Runtime is MapPoint. The Spatial Reference value of the point is 540003. If you investigate the remaining required parameters, you'll note that they require a Viewshed_Distance parameter. Now, refer to the following screenshot. If you don't specify a value, it will use Default Value of 15,000 meters. Lastly, this task will output a Viewshed_Result parameter, which is esriGeometryPolygon. Using this polygon, we can then render to the map or scene.
Geoprocessing synchronously
Now that you've seen an online service, let's look at how we call this service using ArcGIS Runtime. To execute the preceding viewshed task, we first need to create an instance of the geoprocessor object. The geoprocessor object requires a URL down to the task level in the REST endpoint, like this:
Unlock access to the largest independent learning library in Tech for FREE!
Get unlimited access to 7500+ expert-authored eBooks and video courses covering every tech area you can think of.
Note that we've attached /Viewshed on the end of the original URL so that we can pass in the completed path to the task. Next, you will then instantiate the geoprocessor in your app, using the URL to the task:
gpTask = new Geoprocessor(new Uri(viewshedServiceUrl));
Once we have created the geoprocessor, we can then prompt the user to click somewhere on the map. Let's look at some code:
public async void CreateViewshed()
{
// // get a point from the user
var mapPoint = await this.mapView.Editor.RequestPointAsync();
// clear the graphics layers
this.viewshedGraphicsLayer.Graphics.Clear();
this.inputGraphicsLayer.Graphics.Clear();
// add new graphic to layer
this.inputGraphicsLayer.Graphics.Add(new Graphic{ Geometry =
mapPoint, Symbol = this.sms });
// specify the input parameters
var parameter = new GPInputParameter() { OutSpatialReference =
SpatialReferences.WebMercator };
parameter.GPParameters.Add(new
GPFeatureRecordSetLayer("Input_Observation_Point",
mapPoint));
parameter.GPParameters.Add(new
GPLinearUnit("Viewshed_Distance",
LinearUnits.Miles, this.distance));
// Send to the server
this.Status = "Processing on server...";
var result = await gpTask.ExecuteAsync(parameter);
if (result == null || result.OutParameters == null ||
!(result.OutParameters[0] is GPFeatureRecordSetLayer))
throw new ApplicationException("No viewshed graphics
returned for this start point.");
// process the output
this.Status = "Finished processing. Retrieving results...";
var viewshedLayer = result.OutParameters[0] as
GPFeatureRecordSetLayer;
var features = viewshedLayer.FeatureSet.Features;
foreach (Feature feature in features)
{
this.viewshedGraphicsLayer.Graphics.Add(feature as Graphic);
}
this.Status = "Finished!!";
}
The first thing we do is have the user click on the map and return MapPoint. We then clear a couple of GraphicsLayers that hold the input graphic and viewshed graphics, so that the map is cleared every time they run this code. Next, we create a graphic using the location where the user clicked. Now comes the interesting part of this. We need to provide the input parameters for the task and we do that with GPInputParameter. When we instantiate GPInputParameter, we also need to specify the output spatial reference so that the data is rendered in the spatial reference of the map. In this example, we're using the map's spatial reference.
Then, we add the input parameters. Note that we've spelled them exactly as the task required them. If we don't, the task won't work. We also learned earlier that this task requires a distance, so we use GPLinearUnit in Miles. The GPLinearUnit class lets the geoprocessor know what kinds of unit to accept.
After the input parameters are set up, we then call ExecuteAsync. We are calling this method because this is a synchronous geoprocessing task. Even though this method has Async on the end of it, this applies to .NET, not ArcGIS Server. The alternative to ExecuteAsync is SubmitJob, which we will discuss shortly. After some time, the result comes back and we grab the results using result.OutParameters[0]. This contains the output from the geoprocessing task and we want to use that to then render the output to the map. Thankfully, it returns a read-only set of polygons, which we can then add to GraphicsLayer.
If you don't know which parameter to use, you'll need to look it up on the task's page. In the preceding example, the parameter was called Viewshed_Distance and the Data Type value was GPLinearUnit. ArcGIS Runtime comes with a variety of data types to match the corresponding data type on the server. The other supported types are GPBoolean, GPDataFile, GPDate, GPDouble, GPItemID, GPLinearUnit, GPLong, GPMultiValue<T>, GPRasterData, GPRecordSet, and GPString.
Instead of manually inspecting a task as we did earlier, you can also use Geoprocessor.GetTaskInfoAsync to discover all of the parameters. This is a useful object if you want to provide your users with the ability to specify any geoprocessing task dynamically while the app is running. For example, if your app requires that users are able to enter any geoprocessing task, you'll need to inspect that task, obtain the parameters, and then respond dynamically to the entered geoprocessing task.
Geoprocessing asynchronously
So far we've called a geoprocessing task synchronously. In this section, we'll cover how to call a geoprocessing task asynchronously. There are two differences when calling a geoprocessing task asynchronously:
You will run the task by executing a method called SubmitJobAsync instead of ExecuteAsync. The SubmitJobAsync method is ideal for long-running tasks, such as performing data processing on the server. The major advantage of SubmitJobAsync is that users can continue working while the task works in the background. When the task is completed, the results will be presented.
You will need to check the status of the task with GPJobStatus so that users can get a sense of whether the task is working as expected. To do this, check GPJobStatus periodically and it will return GPJobStatus. The GPJobStatus enumeration has the following values: New, Submitted, Waiting, Executing, Succeeded, Failed, TimedOut, Cancelling, Cancelled, Deleting, or Deleted. With these enumerations, you can poll the server and return the status using CheckJobStatusAsync on the task and present that to the user while they wait for the geoprocessor.
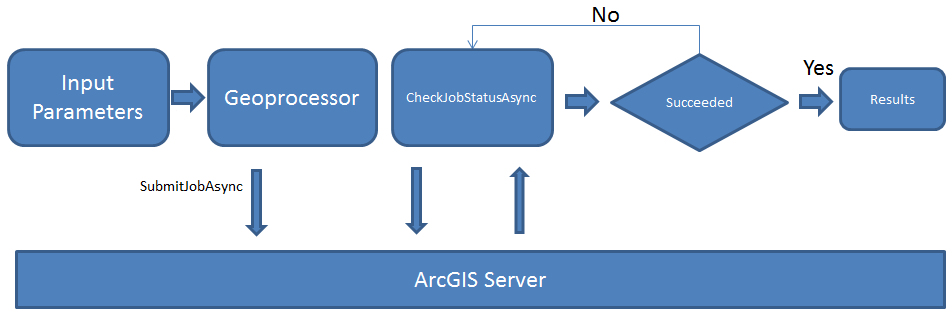
Let's take a look at this process in the following diagram:
As you can see in the preceding diagram, the input parameters are specified as we did earlier with the synchronous task, the Geoprocessor object is set up, and then SubmitJobAsync is called with the parameters (GOInputParameter). Once the task begins, we then have to check the status of it using the results from SubmitJobAsync. We then use CheckJobStatusAsync on the task to return the status enumeration. If it indicates Succeeded, we then do something with the results. If not, we continue to check the status using any time period we specify.
Let's try this out using an example service from Esri that allows for areal analysis. Go to the following REST endpoint: http://serverapps10.esri.com/ArcGIS/rest/services/SamplesNET/USA_Data_ClipTools/GPServer/ClipCounties.
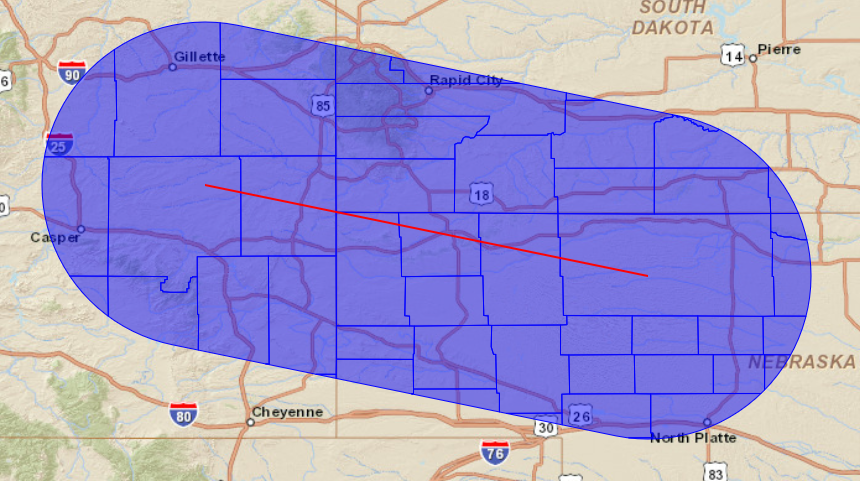
In the service, you will note that it's called ClipCounties. This is a rather contrived example, but it shows how to do server-side data processing. It requires two parameters called Input_Features and Linear_unit. It outputs output_zip and Clipped _Counties. Basically, this task allows you to drag a line on the map; it will then buffer it and clip out the counties in the U.S. and show them on the map, like so:
We are interested in two methods in this sample app. Let's take a look at them:
public async void Clip()
{
//get the user's input line
var inputLine = await this.mapView.Editor.RequestShapeAsync(
DrawShape.Polyline) as Polyline;
// clear the graphics layers
this.resultGraphicsLayer.Graphics.Clear();
this.inputGraphicsLayer.Graphics.Clear();
// add new graphic to layer
this.inputGraphicsLayer.Graphics.Add(
new Graphic { Geometry = inputLine, Symbol =
this.simpleInputLineSymbol });
// add the parameters
var parameter = new GPInputParameter();
parameter.GPParameters.Add(
new GPFeatureRecordSetLayer("Input_Features", inputLine));
parameter.GPParameters.Add(new GPLinearUnit(
"Linear_unit", LinearUnits.Miles, this.Distance));
// poll the task
var result = await SubmitAndPollStatusAsync(parameter);
// add successful results to the map
if (result.JobStatus == GPJobStatus.Succeeded)
{
this.Status = "Finished processing. Retrieving
results...";
var resultData = await
gpTask.GetResultDataAsync(result.JobID,
"Clipped_Counties");
if (resultData is GPFeatureRecordSetLayer)
{
GPFeatureRecordSetLayer gpLayer =
resultData as GPFeatureRecordSetLayer;
if (gpLayer.FeatureSet.Features.Count == 0)
{
// the the map service results
var resultImageLayer = await
gpTask.GetResultImageLayerAsync(
result.JobID, "Clipped_Counties");
// make the result image layer opaque
GPResultImageLayer gpImageLayer =
resultImageLayer;
gpImageLayer.Opacity = 0.5;
this.mapView.Map.Layers.Add(gpImageLayer);
this.Status = "Greater than 500 features returned.
Results drawn using map service.";
return;
}
// get the result features and add them to the
// GraphicsLayer
var features = gpLayer.FeatureSet.Features;
foreach (Feature feature in features)
{
this.resultGraphicsLayer.Graphics.Add(
feature as Graphic);
}
}
this.Status = "Success!!!";
}
}
This Clip method first asks the user to add a polyline to the map. It then clears the GraphicsLayer class, adds the input line to the map in red, sets up GPInputParameter with the required parameters (Input_Featurs and Linear_unit), and calls a method named SubmitAndPollStatusAsync using the input parameters. Let's take a look at that method too:
// Submit GP Job and Poll the server for results every 2 seconds.
private async Task<GPJobInfo>
SubmitAndPollStatusAsync(GPInputParameter parameter)
{
// Submit gp service job
var result = await gpTask.SubmitJobAsync(parameter);
// Poll for the results async
while (result.JobStatus != GPJobStatus.Cancelled &&
result.JobStatus != GPJobStatus.Deleted &&
result.JobStatus != GPJobStatus.Succeeded &&
result.JobStatus != GPJobStatus.TimedOut)
{
result = await gpTask.CheckJobStatusAsync(result.JobID);
foreach (GPMessage msg in result.Messages)
{
this.Status = string.Join(Environment.NewLine,
msg.Description);
}
await Task.Delay(2000);
}
return result;
}
The SubmitAndPollStatusAsync method submits the geoprocessing task and the polls it every two seconds to see if it hasn't been Cancelled, Deleted, Succeeded, or TimedOut. It calls CheckJobStatusAsync, gets the messages of type GPMessage, and adds them to the property called Status, which is a ViewModel property with the current status of the task. We then effectively check the status of the task every 2 seconds with Task.Delay(2000) and continue doing this until something happens other than the GPJobStatus enumerations we're checking for.
Once SubmitAndPollStatusAsync has succeeded, we then return to the main method (Clip) and perform the following steps with the results:
We obtain the results with GetResultDataAsync by passing in the results of JobID and Clipped_Counties. The Clipped_Counties instance is an output of the task, so we just need to specify the name Clipped_Counties.
Using the resulting data, we first check whether it is a GPFeatureRecordSetLayer type. If it is, we then do some more processing on the results.
We then do a cast just to make sure we have the right object (GPFeatureRecordsSetLayer).
We then check to see if no features were returned from the task. If none were returned, we perform the following steps:
We obtain the resulting image layer using GetResultImageLayerAsync. This returns a map service image of the results.
We then cast this to GPResultImageLayer and set its opacity to 0.5 so that we can see through it. If the user enters in a large distance, a lot of counties are returned, so we convert the layer to a map image, and then show them the entire country so that they can see what they've done wrong. Having the result as an image is faster than displaying all of the polygons as the JSON objects.
Add GPResultImageLayer to the map.
If everything worked according to plan, we get only the features needed and add them to GraphicsLayer.
That was a lot of work, but it's pretty awesome that we sent this off to ArcGIS Server and it did some heavy processing for us so that we could continue working with our map. The geoprocessing task took in a user-specified line, buffered it, and then clipped out the counties in the U.S. that intersected with that buffer. When you run the project, make sure you pan or zoom around while the task is running so that you can see that you can still work. You could also further enhance this code to zoom to the results when it finishes.
There are some other pretty interesting capabilities that we need to discuss with this code, so let's delve a little deeper.
Working with the output results
Let's discuss the output of the geoprocessing results in a little more detail in this section.
GPMesssage
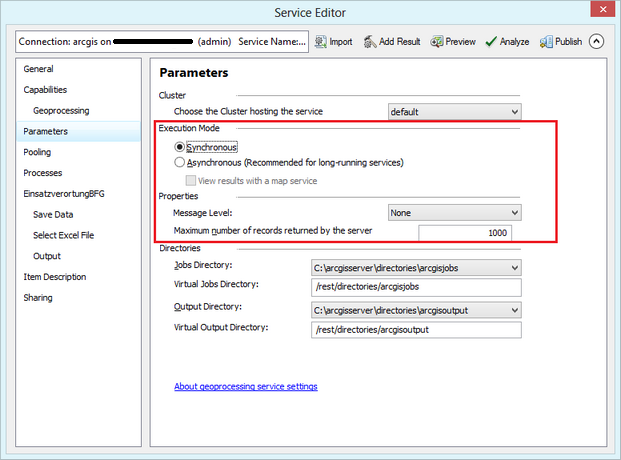
The GPMessage object is very helpful because it can be used to check the types of message that are coming back from Server. It contains different kinds of message via an enumeration called GPMessageType, which you can use to further process the message. GPMessageType returns an enumeration of Informative, Warning, Error, Abort, and Empty. For example, if the task failed, GPMessageType.Error will be returned and you can present a message to the user letting them know what happened and what they can do to resolve this issue. The GPMessage object also returns Description, which we used in the preceding code to display to the user as the task executed. The level of messages returned by Server dictates what messages are returned by the task. See Message Level here:
If the Message Level field is set to None, no messages will be returned. When testing a geoprocessing service, it can be helpful to set the service to Info because it produces detailed messages.
GPFeatureRecordSetLayer
The preceding task expected an output of features, so we cast the result to GPFeatureRecordsSetLayer. The GPFeatureRecordsSetLayer object is a layer type which handles the JSON objects returned by the server, which we can then use to render on the map.
GPResultMapServiceLayer
When a geoprocessing service is created, you have the option of making it produce an output map service result with its own symbology. Refer to http://server.arcgis.com/en/server/latest/publish-services/windows/defining-output-symbology-for-geoprocessing-tasks.htm.
You can take the results of a GPFeatureRecordsSetLayer object and access this map service using the following URL format:
In this article, we went over spatial analysis at a high level, and then went into the details of how to do spatial analysis with ArcGIS Runtime. We discussed how to create models with ModelBuilder and/or Python, and then went on to show how to use geoprocessing, both synchronously and asynchronously, with online and offline tasks. With this information, you now have a multitude of options for adding a wide variety of analytical tools to your apps.

 United States
 Great Britain
 India
India
 Germany
 France
 Canada
 Russia
 Spain
Spain
 Brazil
 Australia
 Singapore
 Canary Islands
 Hungary
 Ukraine
 Luxembourg
 Estonia
 Lithuania
 South Korea
 Turkey
 Switzerland
 Colombia
 Taiwan
 Chile
Chile
 Norway
 Ecuador
 Indonesia
 New Zealand
 Cyprus
 Denmark
 Finland
 Poland
 Malta
Malta
 Czechia
 Austria
 Sweden
 Italy
Italy
 Egypt
Egypt
 Belgium
 Portugal
 Slovenia
 Ireland
 Romania
 Greece
 Argentina
 Netherlands
 Bulgaria
 Latvia
 South Africa
 Malaysia
 Japan
Japan
 Slovakia
 Philippines
 Mexico
 Thailand