


Kristin Adderson
December 14, 2020 – 8:37pm
Retail already changed from being product to more customer-centric influenced by increasing omni-channel initiatives that encourage digital transformation. Then Covid-19 hit. What retailers learned is that they must be willing and able to adapt quickly to internal and external forces. The silver lining is at the heart of digital transformation and adaptability is data.
According to McKinsey & Company, due to Covid-19, companies accelerated digital transformation by seven years. Tableau observed this with our retail customers as most staff were forced to work remotely, curb-side service became a required option for customers, and innovative solutions were needed to protect the safety of employees and customers. And it is no surprise that digital commerce exploded with an increased desire to shop online and limit face-to-face interactions. According to Salesforce, a new global record was hit on Black Friday for digital revenue with over $60B in online spend, a growth of 30 percent over last year.
As our retail and consumer goods customers focus on wrapping up the holiday shopping season and a tumultuous year, we wanted to give them an early preview of an upcoming whitepaper, releasing in January 2021. The visualized data will address common but nagging issues like in-stock position and product availability, online customer journey, competitive pricing, supply chain optimization, and loyalty program analysis, among others.
Let’s explore visual analyses that reveal critical inventory and customer location insights, which lead to better site location and marketing opportunities.
On-Shelf Availability Dashboards
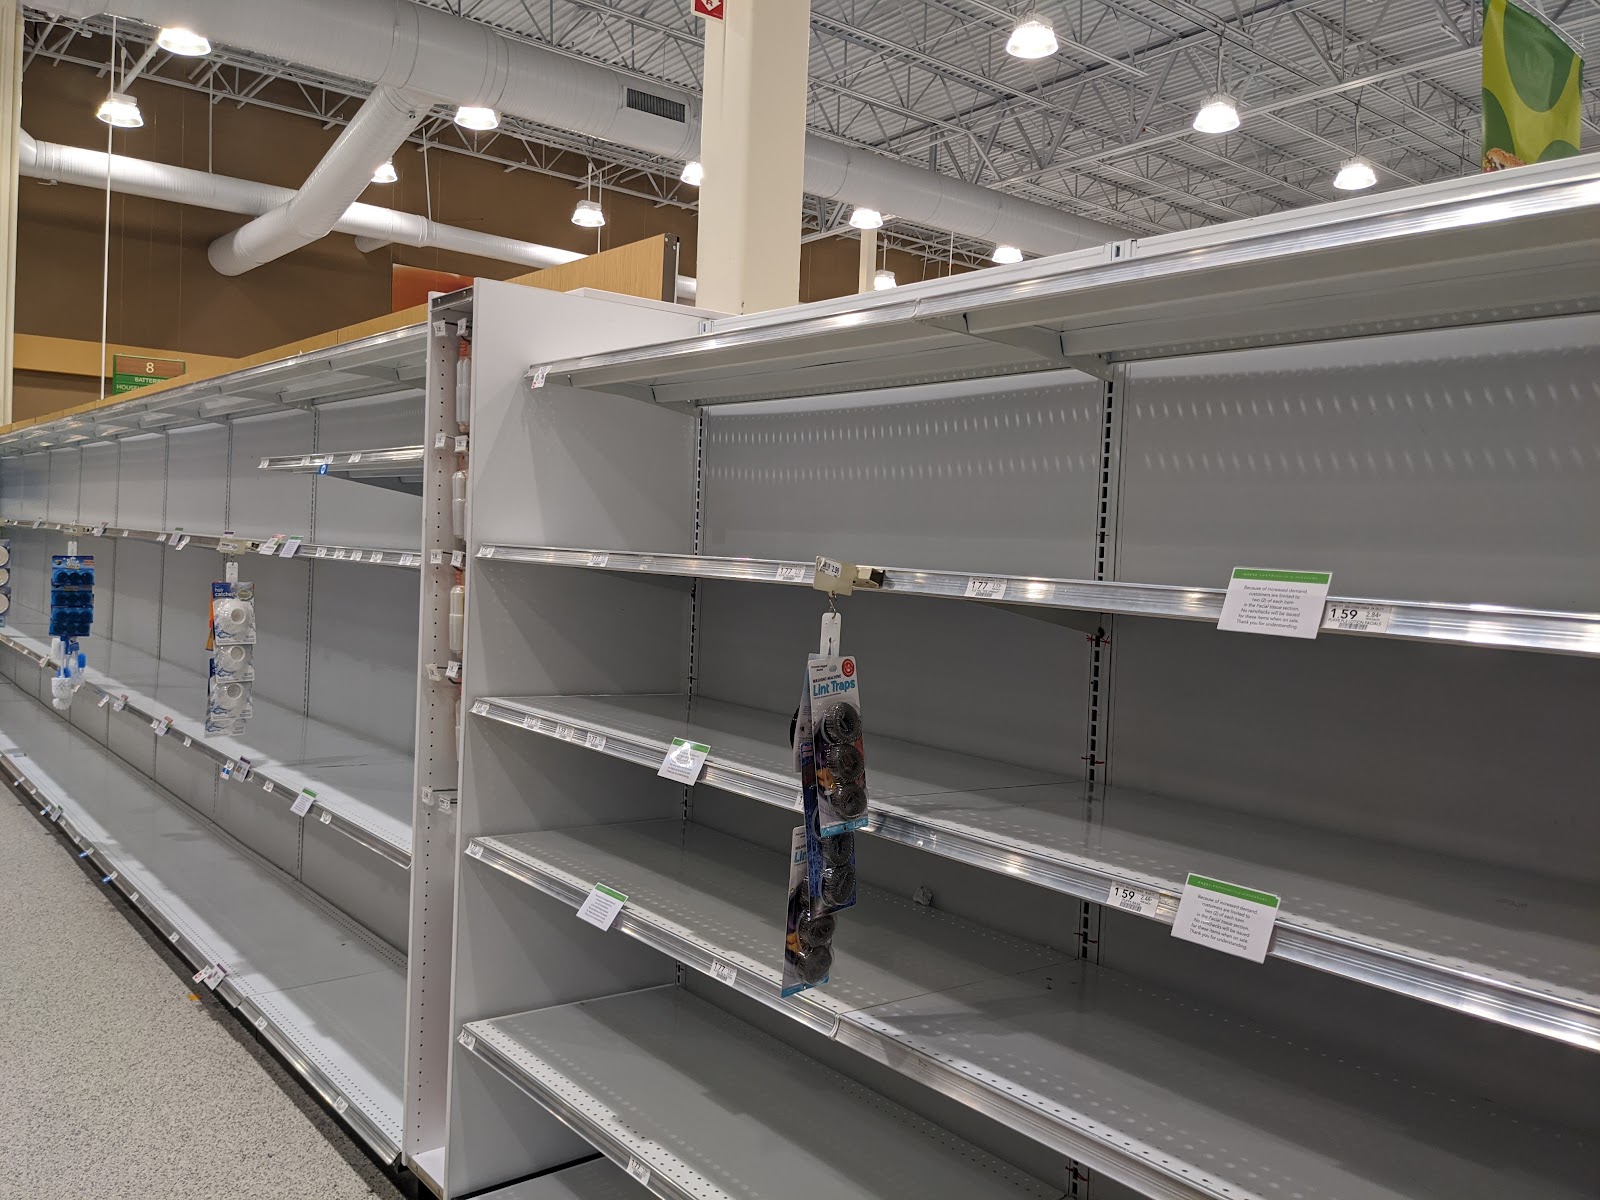
Empty shelves were a typical scene in March, posing problems for stores and customers. Need toilet paper or baby formula? There was none. They flew off the shelves as quickly as they were stocked. These dashboards connect inventory and availability to grocers, suppliers, stores, and warehouses, so the fast-moving consumer goods (FMCG) industry can act to eliminate out-of-stocks. Here’s to more availability of toilet paper in 2021!
“Stock in Trade” Dashboard
This visual analysis created by Tableau partner, Atheon Analytics, helps retailers and their suppliers quickly and easily see where inventory is under- or over-stocked by grocer and store location. As a supplier, further examine product availability in warehouses (depots in the UK) to know where stock must be allocated, ensuring availability at certain stores. Unifying retailers, suppliers, and manufacturers around this near real-time data is essential going forward to support constantly changing customer demands.
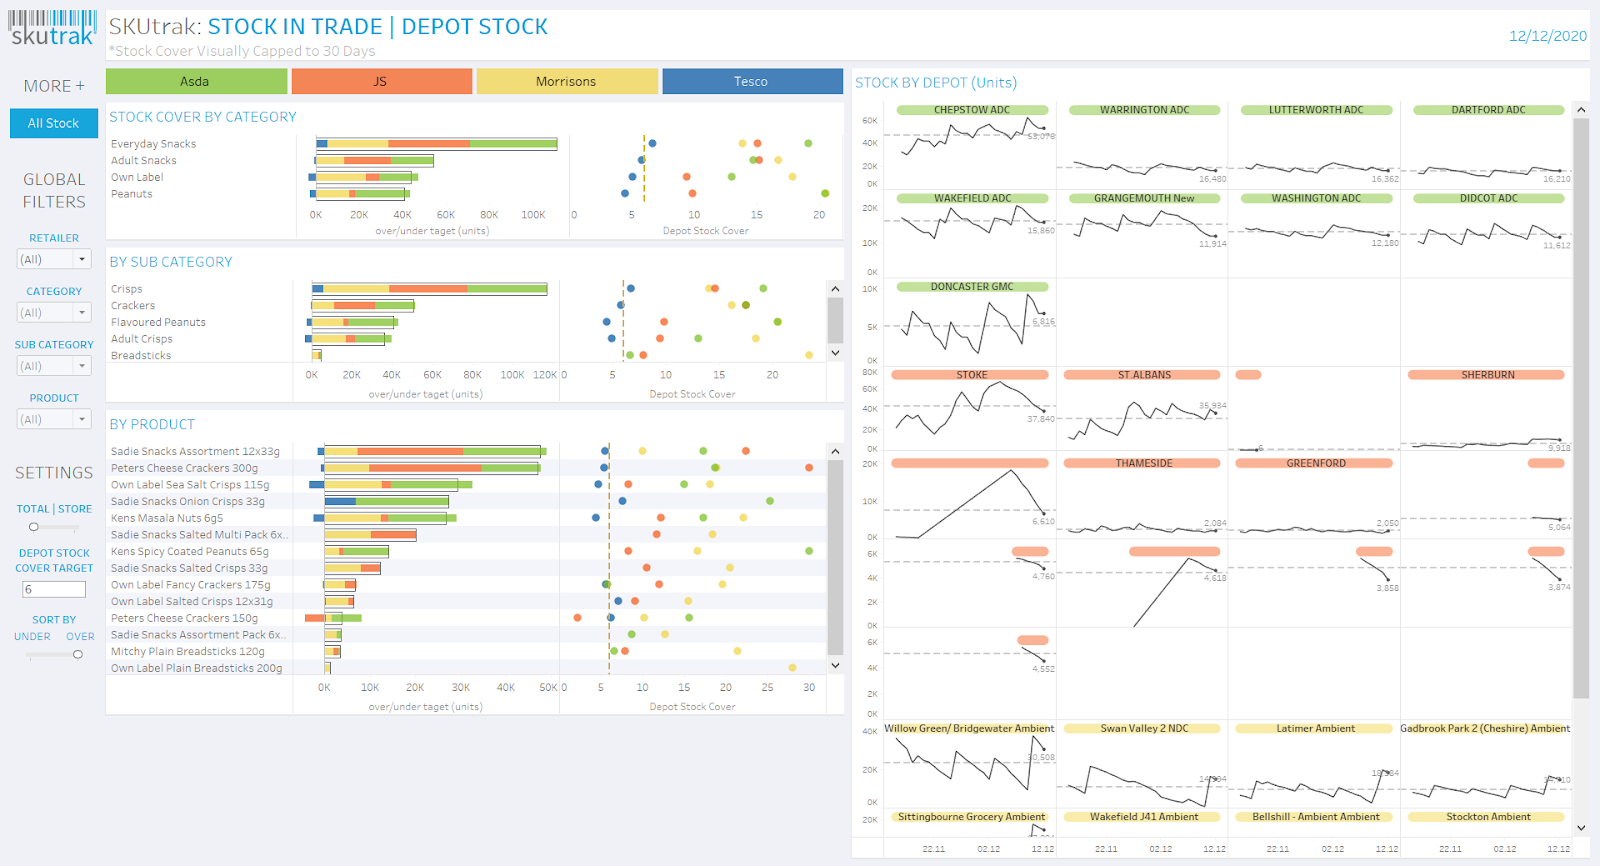
In the next example, see the product data, category, or sub-category rolled up to the individual grocer. Visualized on the right is current demand compared with stock levels, so you know when you are approaching dangerously low or no inventory to support customers.
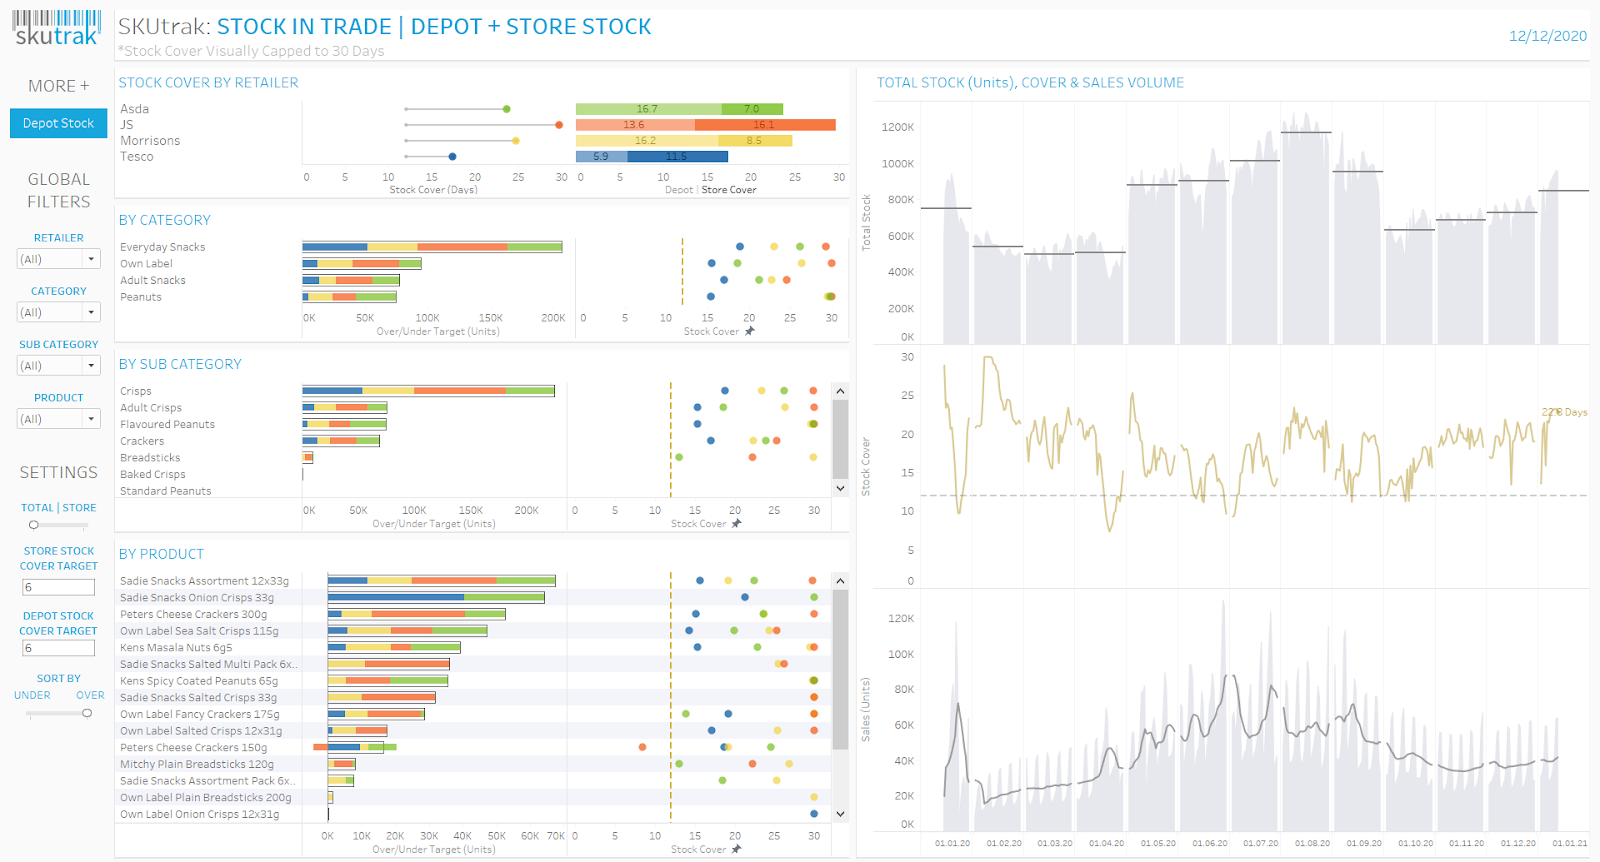
Atheon Analytics brings together this critical information from suppliers and retailers in Snowflake to effectively work from one operational canvas and act in unison.
Customer Location and Site Selection Dashboards
With lockdowns and work from home mandates leading to a reduction in commuting, many retailers observed a dramatic change in customer flows. They should take a fresh, on-going look at current customer location data and competitors to quickly and confidently know the changing dynamics of their local markets and how customer composition changes throughout the day.
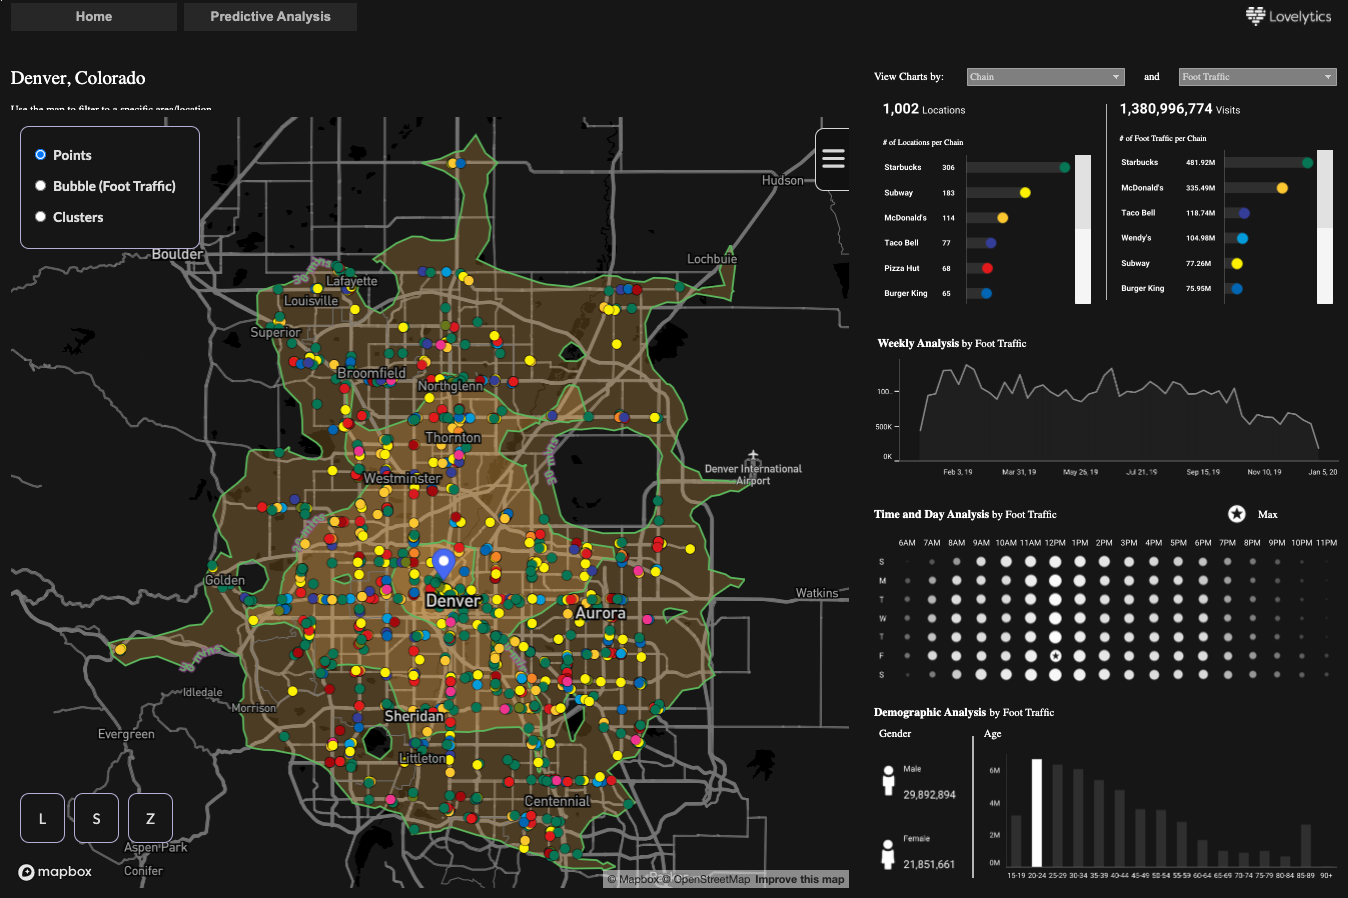
Leading that charge is Tableau partner, Lovelytics, which created a “Customer Location and Site Selection” dashboard, powered by global location provider, Foursquare. It analyzes the Foursquare Visits data feed using geospatial analysis, offers an option to add your own customer demographics and traffic data, and enables businesses to pinpoint an optimal site for opening or where to use an existing location, helping inform customer marketing and targeting.
Evaluate via spatial analysis the number of visitors, the amount of foot traffic, and how the flow of customers changes. This information could easily be combined with real-time sales and loyalty data, and allow for restaurants, in this example, to use Salesforce Einstein for creating a churn analysis, predicting customers they may lose, and knowing when to activate a new retention campaign within Salesforce Marketing Cloud.
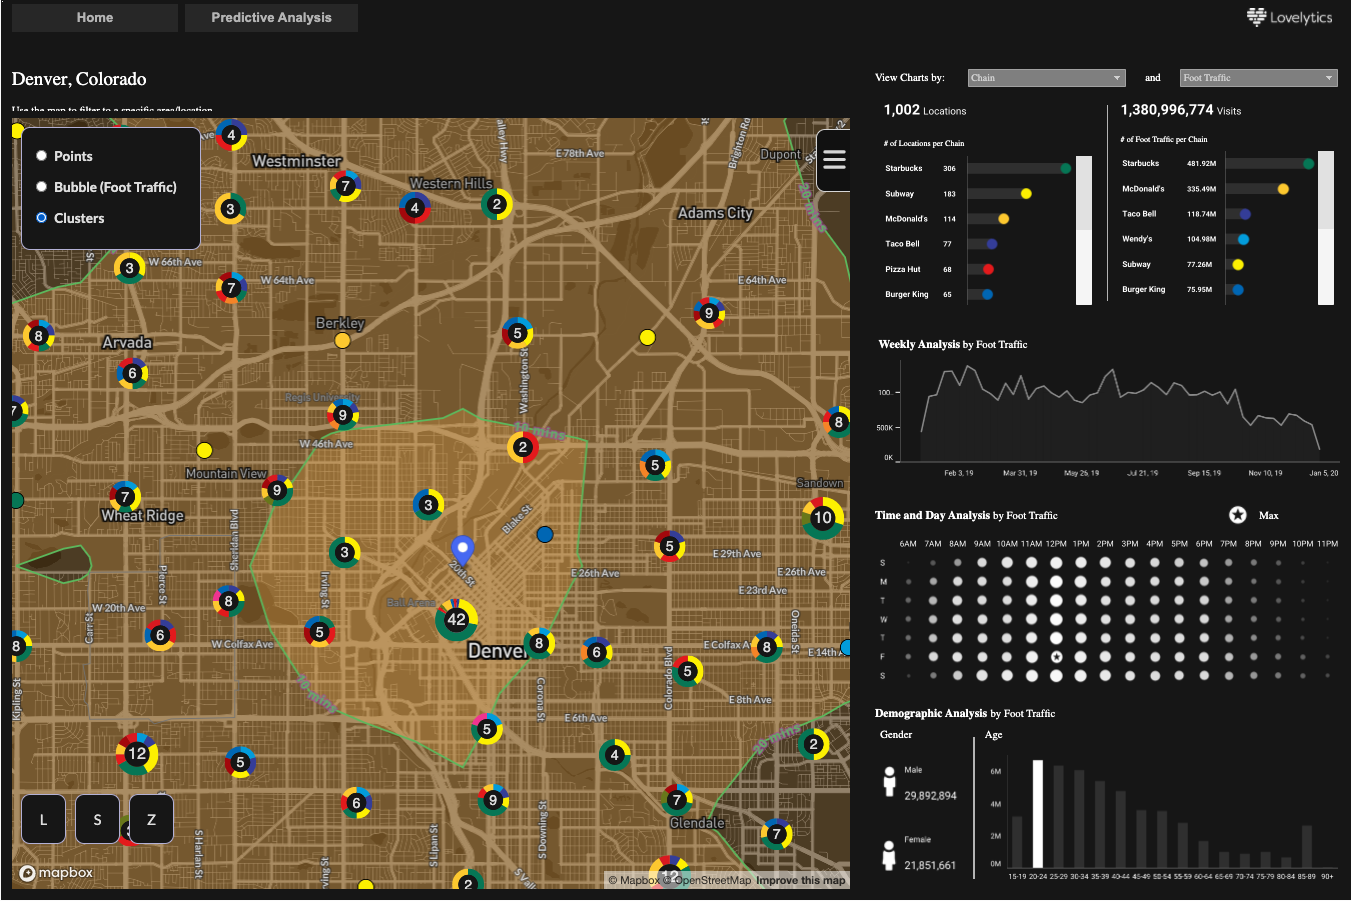
This location view specifically analyzes more than 1.3 million site visits to various restaurant chains in the Denver, Colorado area with the option to look closely by store location, day, and hour. In Tableau, it is easy to “playback” how local areas are changing and how that impacts existing stores. It is also an incredible way to ensure new site selection won’t cannibalize existing locations and that you allocate the correct labor to offer a safe, high-quality experience for customers.
Benefits of inventory and customer clarity for retail
Demystifying inventory availability and ensuring grocers, suppliers, and warehouses (or depots) are aligned ensures that the right inventory gets to the right stores as customer demands and traffic change on a dime. This same data can help remove the guesswork with new store construction builds or help prioritize remodels.
We look forward to sharing the remaining dashboards next month—and all interactive examples will be free to access on Tableau Public. Have a very safe and enjoyable holiday season!
Join the discussion
Join over 3,500 retail and consumer goods customers to discuss and talk about retail analytics, ask questions, and provide help.
About the Partners
We want to thank Atheon Analytics and Lovelytics for their participation. To learn more about these incredible examples highlighted, please connect with them.