In this article by Chad R. Adams, author of the book, Mastering JavaScript High Performance, we are going to take a look at the process of optimizing JavaScript for iOS web apps (also known as hybrid apps). We will take a look at some common ways of debugging and optimizing JavaScript and page performance, both in a device's web browser and a standalone app's web view.
Also, we'll take a look at the Apple Web Inspector and see how to use it for iOS development. Finally, we will also gain a bit of understanding about building a hybrid app and learn the tools that help to better build JavaScript-focused apps for iOS. Moreover, we'll learn about a class that might help us further in this.
We are going to learn about the following topics in the article:
Getting ready for iOS development
iOS hybrid development
(For more resources related to this topic, see here.)
Getting ready for iOS development
Before starting this article with Xcode examples and using iOS Simulator, I will be displaying some native code and will use tools that haven't been covered in this course. Mobile app developments, regardless of platform, are books within themselves. When covering the build of the iOS project, I will be briefly going over the process of setting up a project and writing non-JavaScript code to get our JavaScript files into a hybrid iOS WebView for development. This is essential due to the way iOS secures its HTML5-based apps. Apps on iOS that use HTML5 can be debugged, either from a server or from an app directly, as long as the app's project is built and deployed in its debug setting on a host system (meaning the developers machine).
Readers of this article are not expected to know how to build a native app from the beginning to the end. And that's completely acceptable, as you can copy-and-paste, and follow along as I go. But I will show you the code to get us to the point of testing JavaScript code, and the code used will be the smallest and the fastest possible to render your content.
All of these code samples will be hosted as an Xcode project solution of some type on Packt Publishing's website, but they will also be shown here if you want to follow along, without relying on code samples. Now with that said, lets get started…
iOS hybrid development
Xcode is the IDE provided by Apple to develop apps for both iOS devices and desktop devices for Macintosh systems. As a JavaScript editor, it has pretty basic functions, but Xcode should be mainly used in addition to a project's toolset for JavaScript developers. It provides basic code hinting for JavaScript, HTML, and CSS, but not more than that.
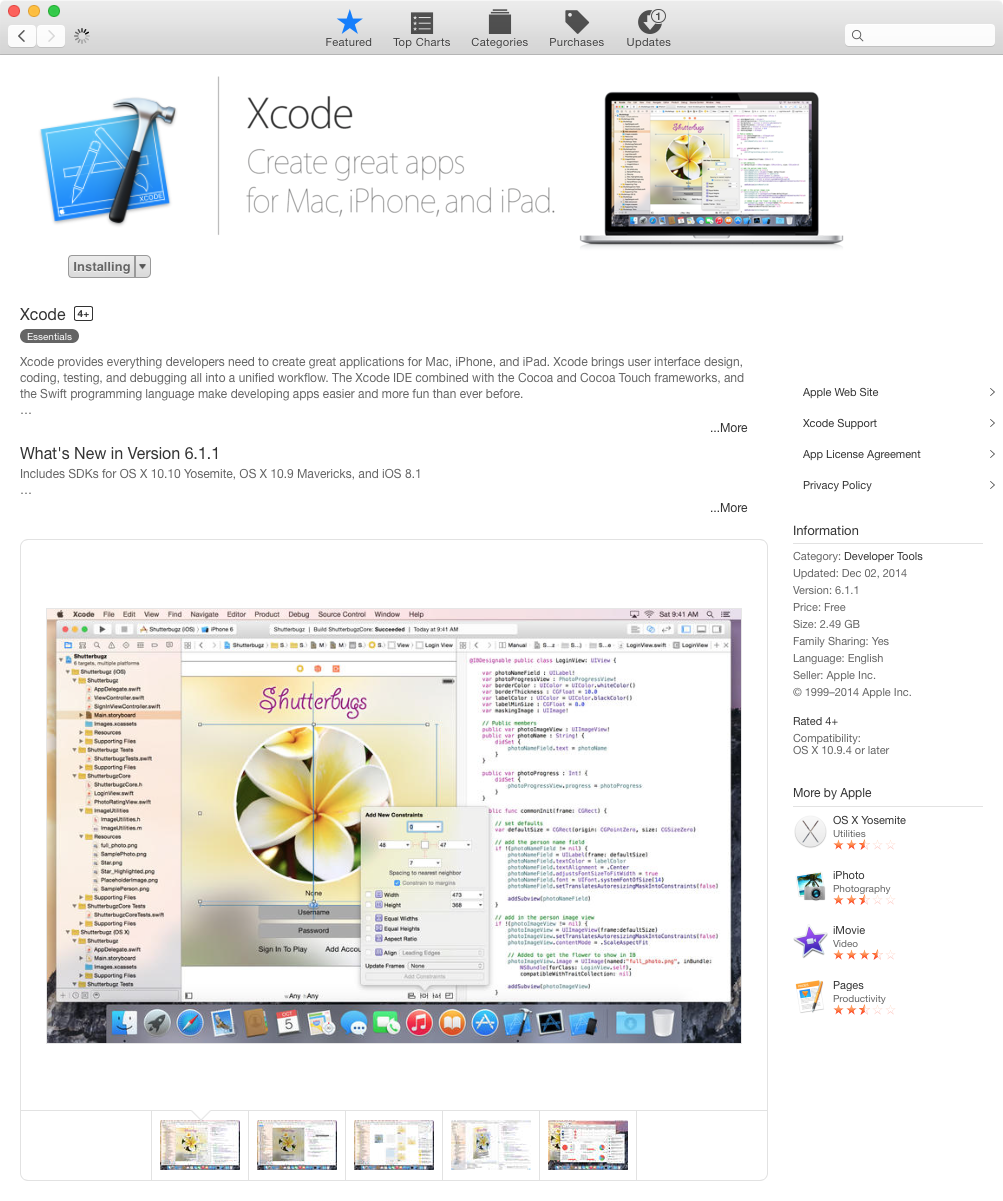
To install Xcode, we will need to start the installation process from the Mac App Store. Apple, in recent years, has moved its IDE to the Mac App Store for faster updates to developers and subsequently app updates for iOS and Mac applications. Installation is easy; simply log in with your Apple ID in the Mac App Store and download Xcode; you can search for it at the top or, if you look in the right rail among popular free downloads, you can find a link to the Xcode Mac App Store page. Once you reach this, click Install as shown in the following screenshot:
It's important to know that, for the sake of simplicity in this article, we will not deploy an app to a device; so if you are curious about it, you will need to be actively enrolled in Apple's Developer Program. The cost is 99 dollars a year, or 299 dollars for an enterprise license that allows deployment of an app outside the control of the iOS App Store.
If you're curious to learn more about deploying to a device, the code in this article will run on the device assuming that your certificates are set up on your end.
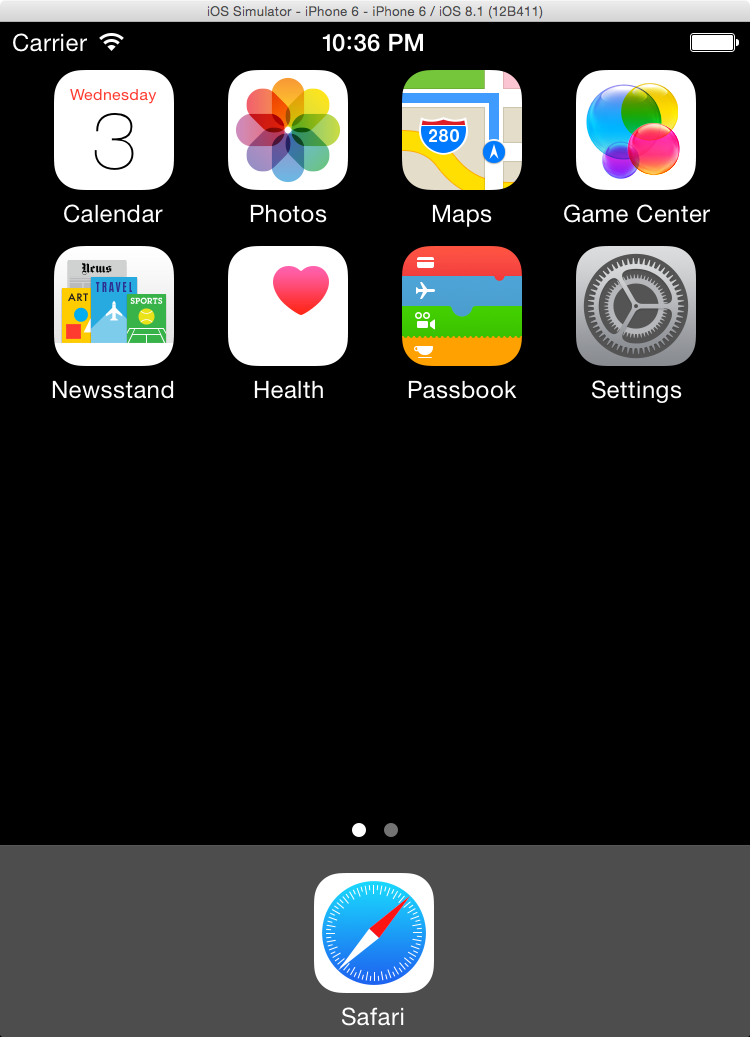
Once it's installed, we can open up Xcode and look at the iOS Simulator; we can do this by clicking XCode, followed by Open Developer Tool, and then clicking on iOS Simulator. Upon first opening iOS Simulator, we will see what appears to be a simulation of an iOS device, shown in the next screenshot. Note that this is a simulation, not a real iOS device (even if it feels pretty close).
A neat trick for JavaScript developers working with local HTML files outside an app is that they can quickly drag-and-drop an HTML file. Due to this, the simulator will open the mobile version of Safari, the built-in browser for iPhone and iPads, and render the page as it would do on an iOS device; this is pretty helpful when testing pages before deploying them to a web server.
Setting up a simple iOS hybrid app
JavaScript performance on a built-in hybrid application can be much slower than the same page run on the mobile version of Safari. To test this, we are going to build a very simple web browser using Apple's new programming language Swift. Swift is an iOS-ready language that JavaScript developers should feel at home with.
Swift itself follows a syntax similar to JavaScript but, unlike JavaScript, variables and objects can be given types allowing for stronger, more accurate coding. In that regard, Swift follows syntax similar to what can be seen in the ECMAScript 6 and TypeScript styles of coding practice. If you are checking these newer languages out, I encourage you to check out Swift as well.
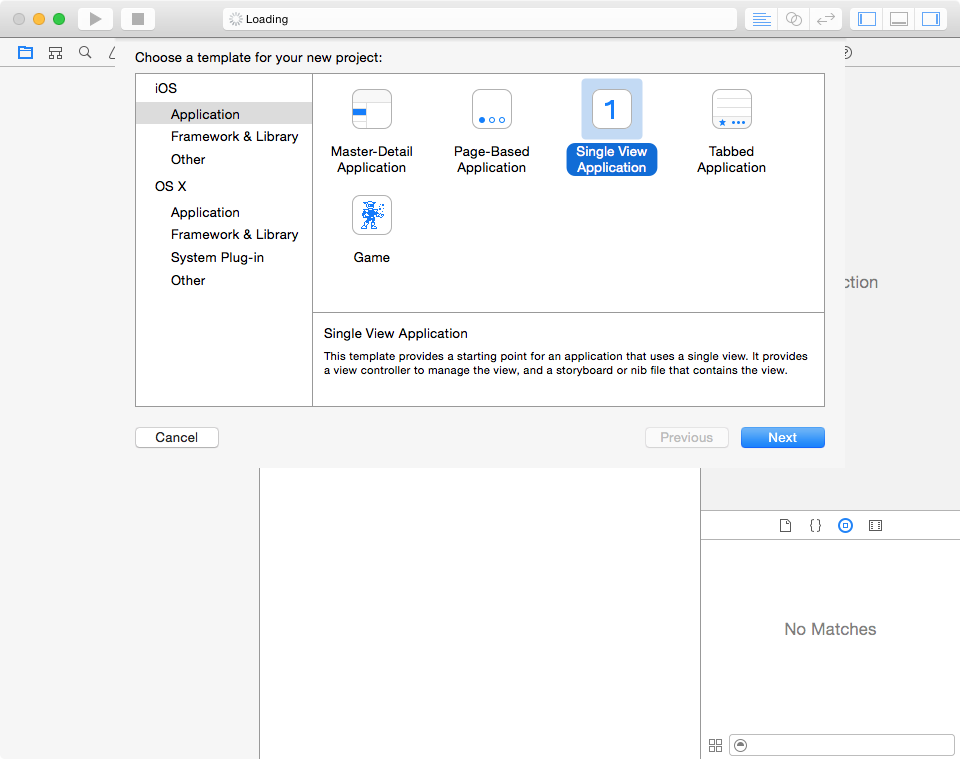
Now let's create a simple web view, also known as a UIWebView, which is the class used to create a web view in an iOS app. First, let's create a new iPhone project; we are using an iPhone to keep our app simple. Open Xcode and select the Create new XCode project project; then, as shown in the following screenshot, select the Single View Application option and click the Next button.
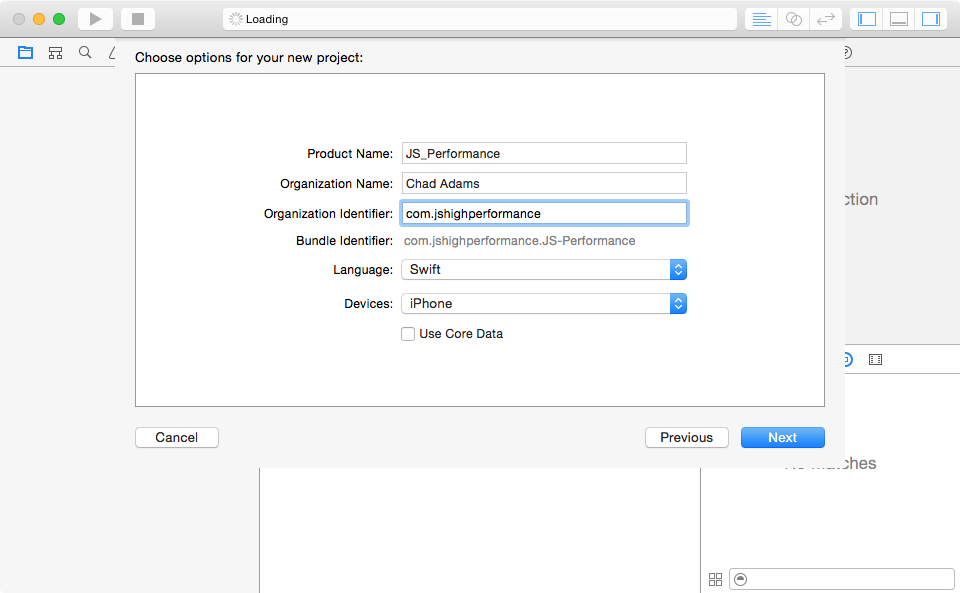
On the next view of the wizard, set the product name as JS_Performance, the language to Swift, and the device to iPhone; the organization name should autofill with your name based on your account name in the OS. The organization identifier is a reverse domain name unique identifier for our app; this can be whatever you deem appropriate. For instructional purposes, here's my setup:
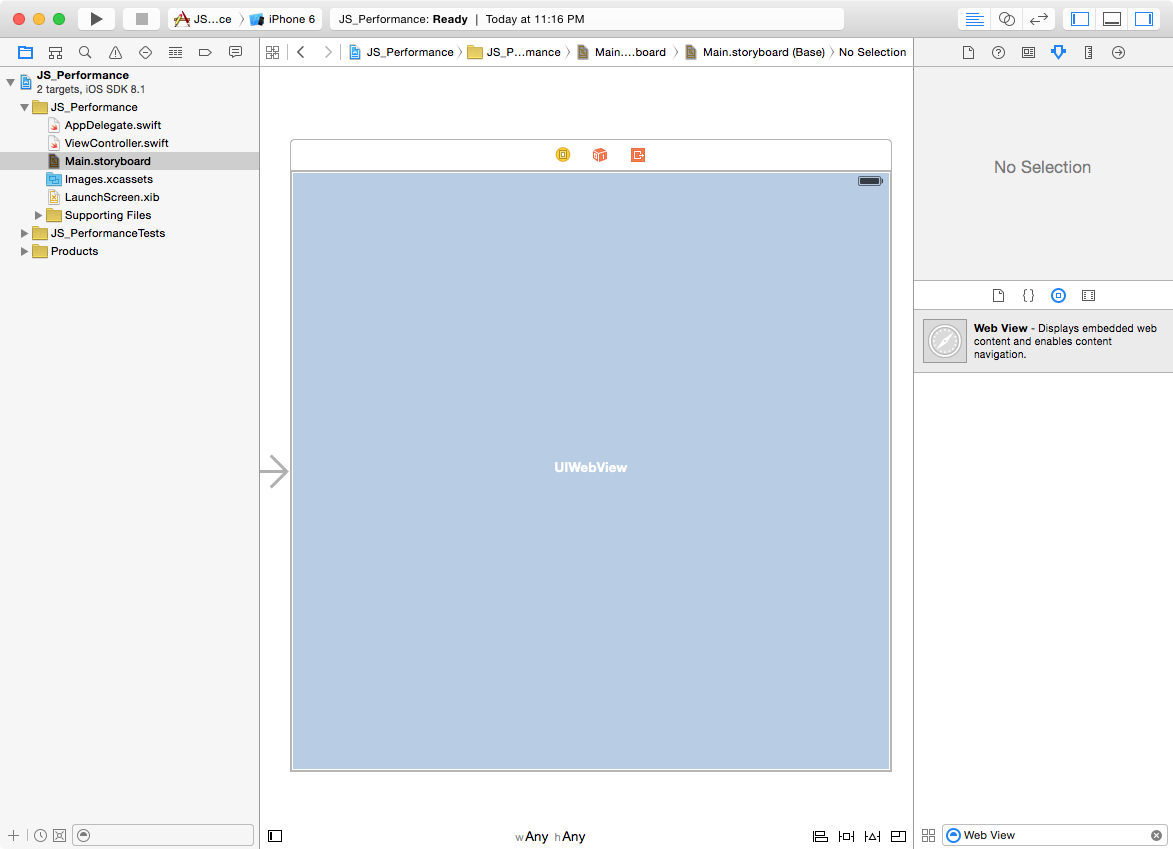
Once your project names are set, click the Next button and save to a folder of your choice with Git repository left unchecked. When that's done, select Main.storyboard under your Project Navigator, which is found in the left panel. We should be in the storyboard view now. Let's open the Object Library, which can be found in the lower-right panel in the subtab with an icon of a square inside a circle.
Search for Web View in the Object Library in the bottom-right search bar, and then drag that to the square view that represents our iOS view.
We need to consider two more things before we link up an HTML page using Swift; we need to set constraints as native iOS objects will be stretched to fit various iOS device windows. To fill the space, you can add the constraints by selecting the UIWebView object and pressing Command + Option + Shift + = on your Mac keyboard. Now you should see a blue border appear briefly around your UIWebView.
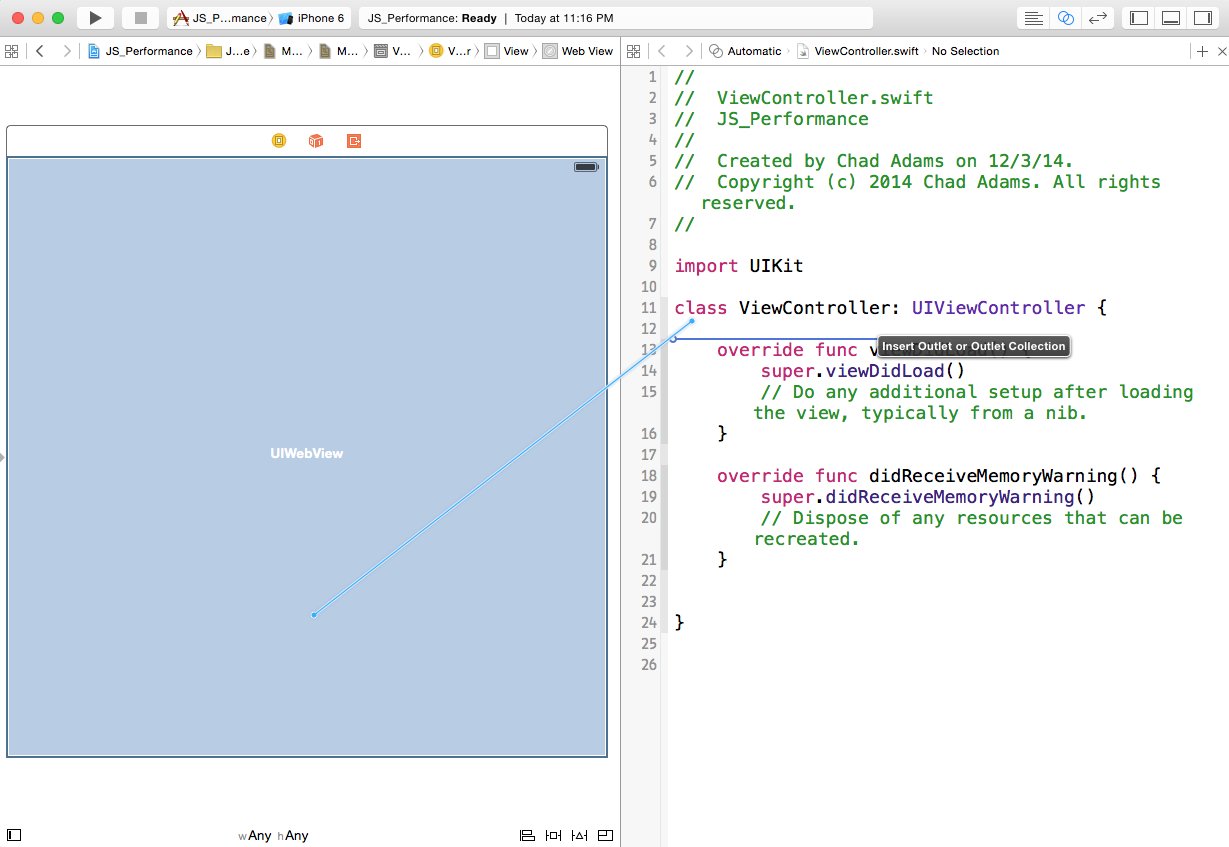
Lastly, we need to connect our UIWebView to our Swift code; for this, we need to open the Assistant Editor by pressing Command + Option + Return on the keyboard. We should see ViewController.swift open up in a side panel next to our Storyboard. To link this as a code variable, right-click (or option-click the UIWebView object) and, with the button held down, drag the UIWebView to line number 12 in the ViewController.swift code in our Assistant Editor. This is shown in the following diagram:
Once that's done, a popup will appear. Now leave everything the same as it comes up, but set the name to webview; this will be the variable referencing our UIWebView. With that done, save your Main.storyboard file and navigate to your ViewController.swift file.
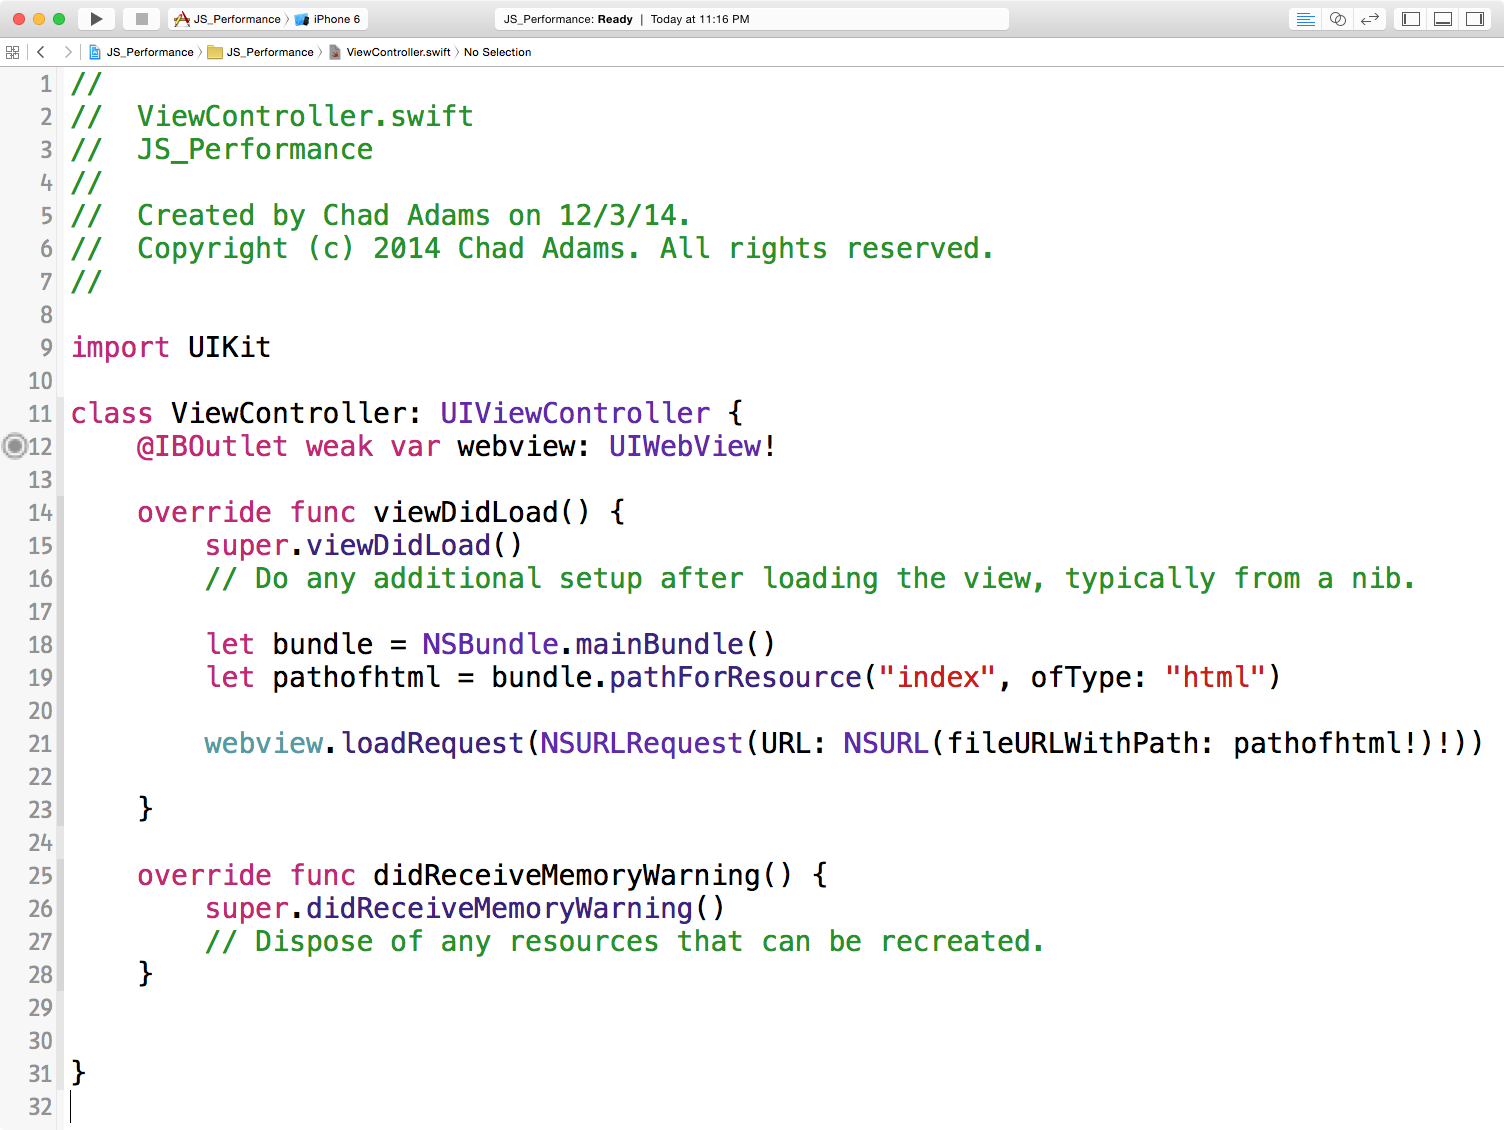
Now take a look at the Swift code shown in the following screenshot, and copy it into the project; the important part is on line 19, which contains the filename and type loaded into the web view; which in this case, this is index.html.
Now obviously, we don't have an index.html file, so let's create one. Go to File and then select New followed by the New File option. Next, under iOS select Empty Application and click Next to complete the wizard. Save the file as index.html and click Create. Now open the index.html file, and type the following code into the HTML page:
<br />Hello <strong>iOS</strong>
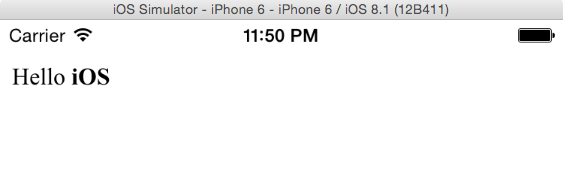
Now click Run (the play button in the main iOS task bar), and we should see our HTML page running inside our own app, as shown here:
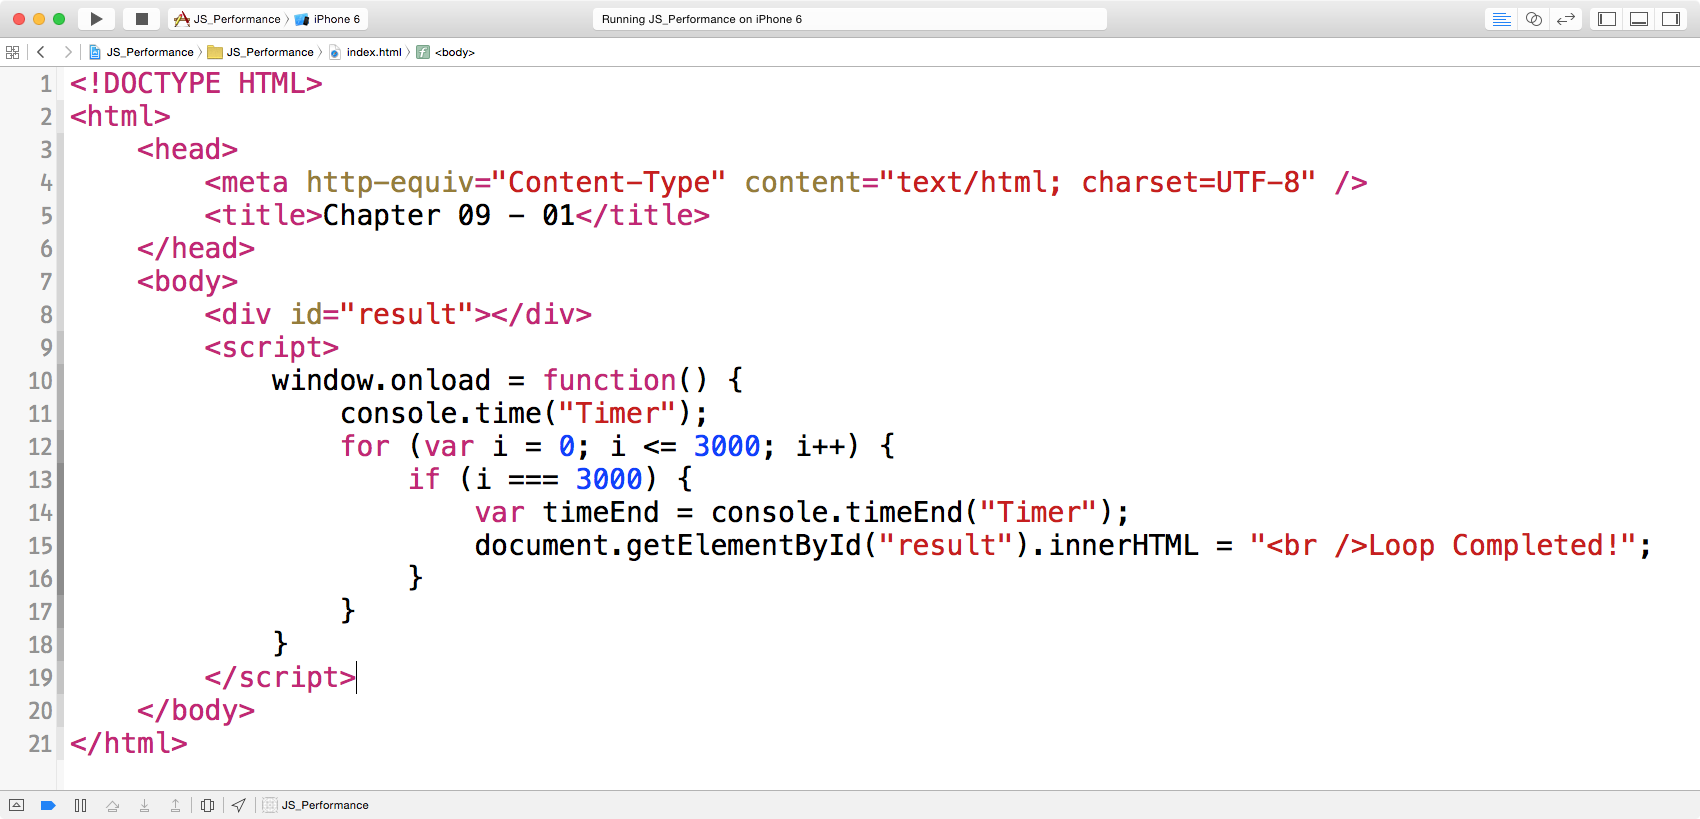
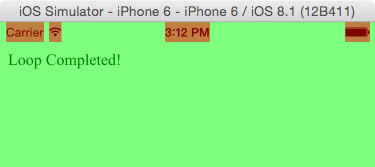
That's nice work! We built an iOS app with Swift (even if it's a simple app). Let's create a structured HTML page; we will override our Hello iOS text with the HTML shown in the following screenshot:
Here, we use the standard console.time function and print a message to our UIWebView page when finished; if we hit Run in Xcode, we will see the Loop Completed message on load. But how do we get our performance information? How can we get our console.timeEnd function code on line 14 on our HTML page?
Using Safari web inspector for JavaScript performance
Apple does provide a Web Inspector for UIWebViews, and it's the same inspector for desktop Safari. It's easy to use, but has an issue: the inspector only works on iOS Simulators and devices that have started from an Xcode project. This limitation is due to security concerns for hybrid apps that may contain sensitive JavaScript code that could be exploited if visible.
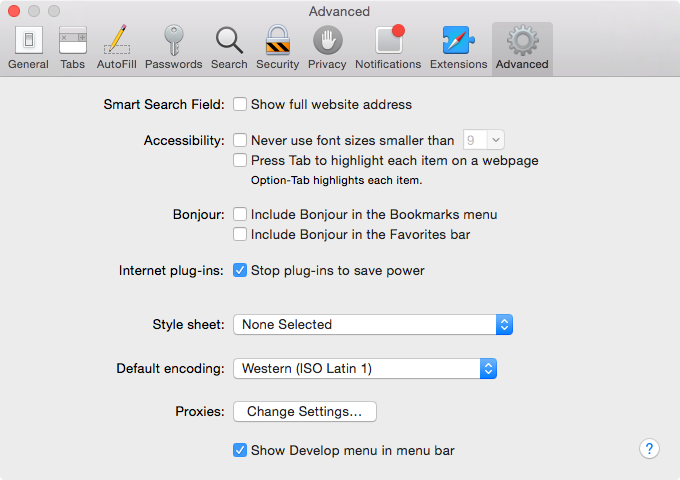
Let's check our project's embedded HTML page console. First, open desktop Safari on your Mac and enable developer mode. Launch the Preferences option. Under the Advanced tab, ensure that the Show develop menu in menu bar option is checked, as shown in the following screenshot:
Unlock access to the largest independent learning library in Tech for FREE!
Get unlimited access to 7500+ expert-authored eBooks and video courses covering every tech area you can think of.
Renews at $19.99/month. Cancel anytime
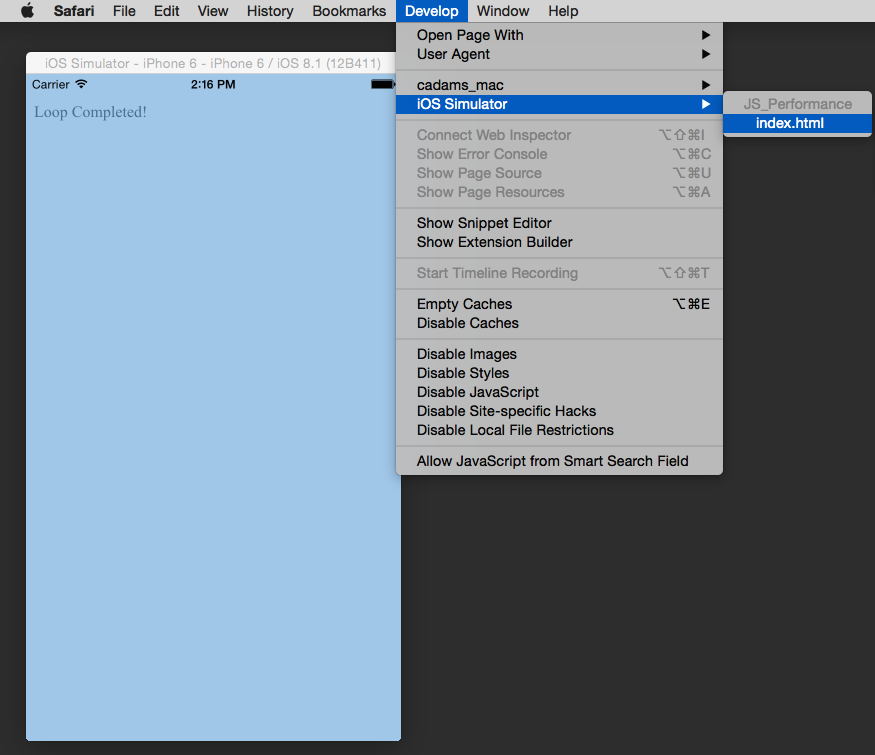
Next, let's rerun our Xcode project, start up iOS Simulator and then rerun our page. Once our app is running with the Loop Completed result showing, open desktop Safari and click Develop, then iOS Simulator, followed by index.html.
If you look closely, you will see iOS simulator's UIWebView highlighted in blue when you place the mouse over index.html; a visible page is seen as shown in the following screenshot:
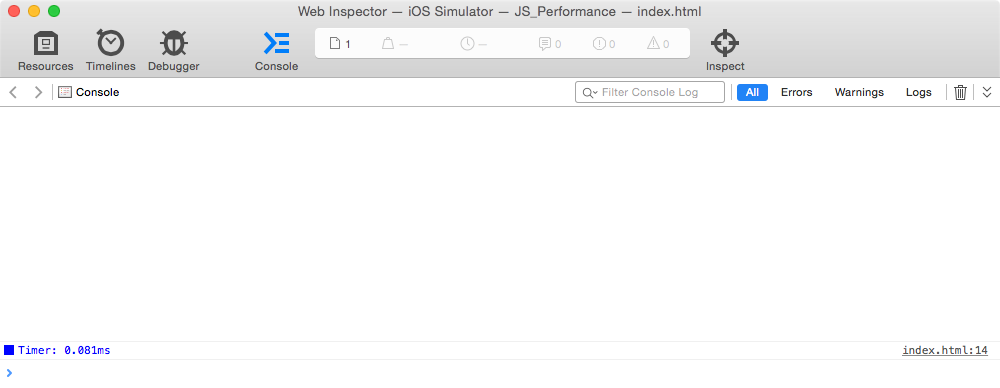
Once we release the mouse on index.html, we Safari's Web Inspector window appears featuring our hybrid iOS app's DOM and console information. The Safari's Web Inspector is pretty similar to Chrome's Developer tools in terms of feature sets; the panels used in the Developer tools also exist as icons in Web Inspector.
Now let's select the Console panel in Web Inspector. Here, we can see our full console window including our Timerconsole.time function test included in the for loop. As we can see in the following screenshot, the loop took 0.081 milliseconds to process inside iOS.
Comparing UIWebView with Mobile Safari
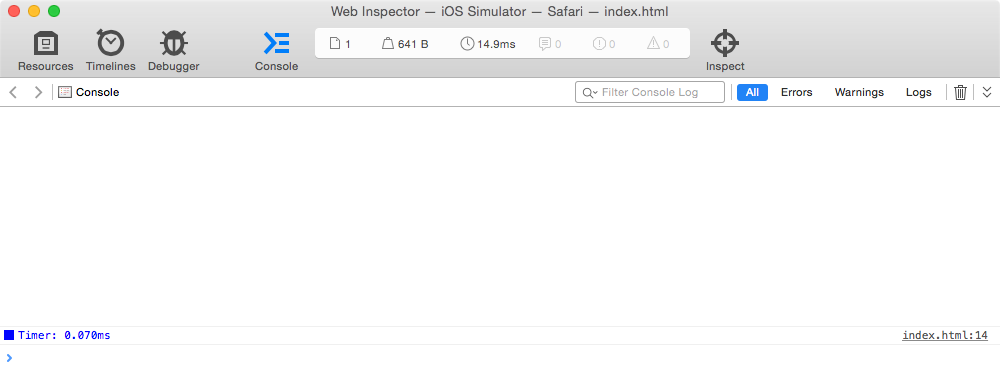
What if we wanted to take our code and move it to Mobile Safari to test? This is easy enough; as mentioned earlier in the article, we can drag-and-drop the index.html file into our iOS Simulator, and then the OS will open the mobile version of Safari and load the page for us.
With that ready, we will need to reconnect Safari Web Inspector to the iOS Simulator and reload the page. Once that's done, we can see that our console.time function is a bit faster; this time it's roughly 0.07 milliseconds, which is a full .01 milliseconds faster than UIWebView, as shown here:
For a small app, this is minimal in terms of a difference in performance. But, as an application gets larger, the delay in these JavaScript processes gets longer and longer.
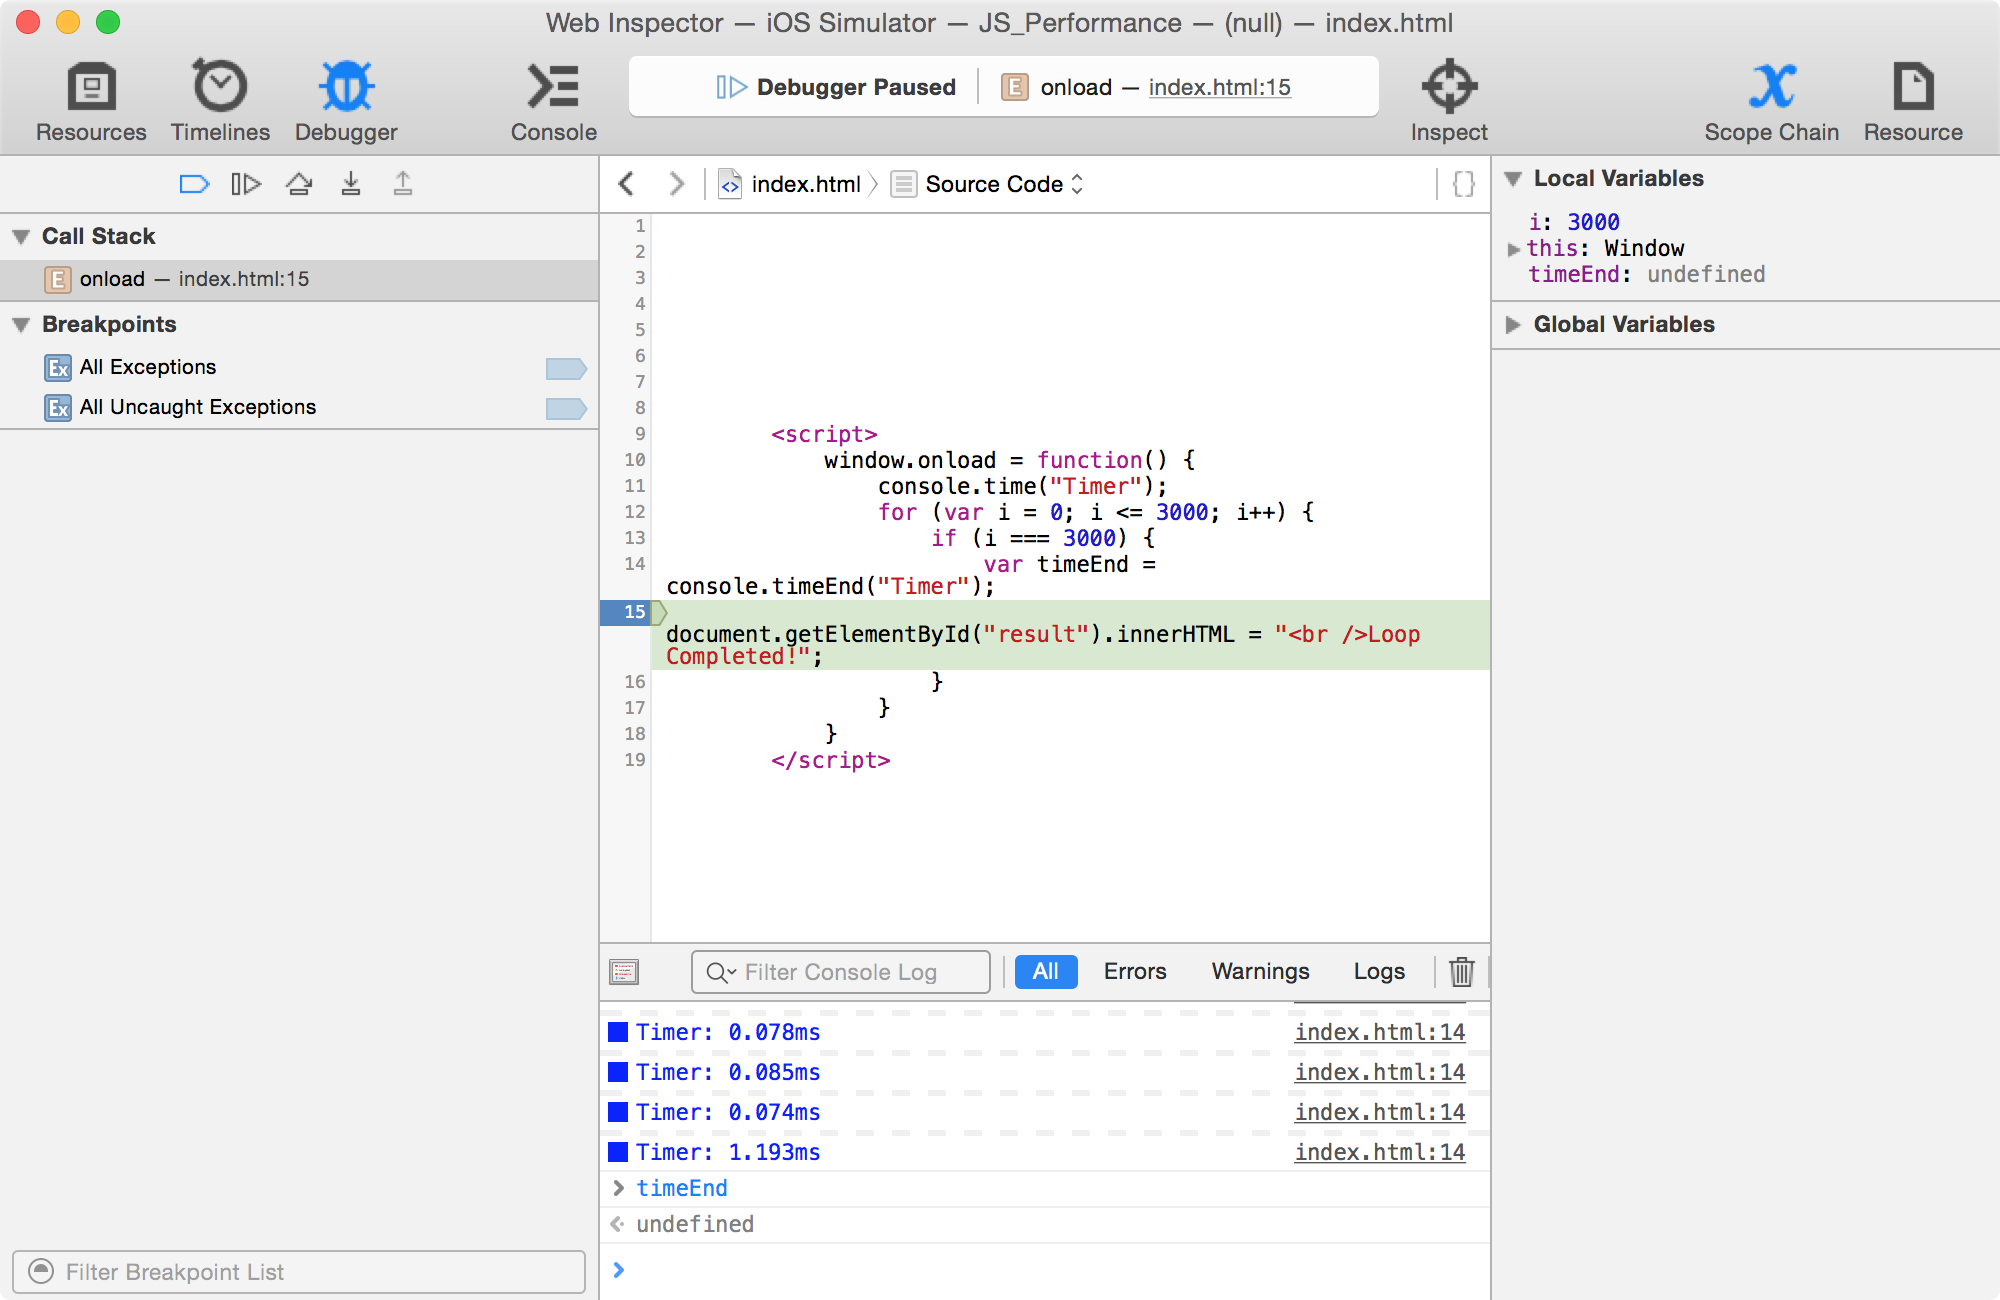
We can also debug the app using the debugging inspector in the Safari's Web Inspector tool. Click Debugger in the top menu panel in Safari's Web Inspector. We can add a break point to our embedded script by clicking a line number and then refreshing the page with Command + R. In the following screenshot, we can see the break occurring on page load, and we can see our scope variable displayed for reference in the right panel:
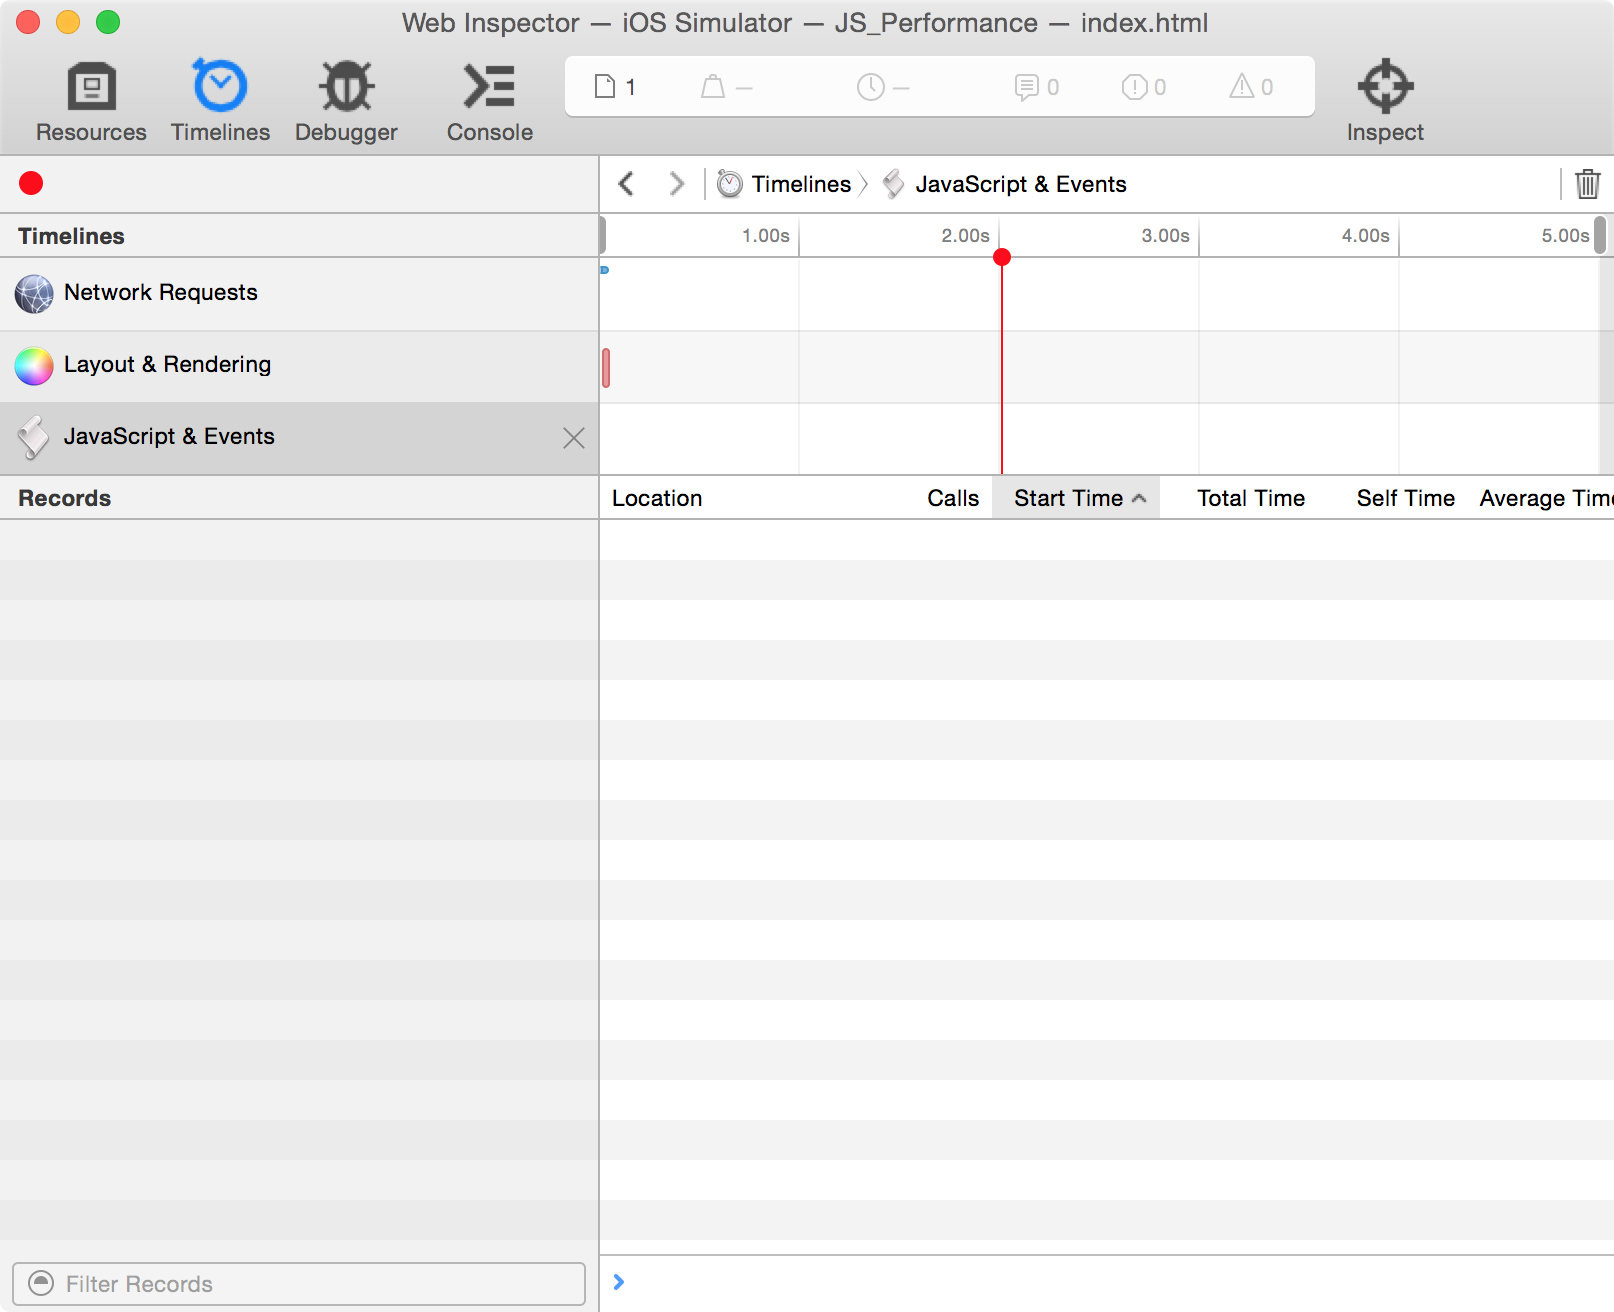
We can also check page load times using the timeline inspector. Click Timelines at the top of the Web Inspector and now we will see a timeline similar to the Resources tab found in Chrome's Developer tools. Let's refresh our page with Command + R on our keyboard; the timeline then processes the page.
Notice that after a few seconds, the timeline in the Web Inspector stops when the page fully loads, and all JavaScript processes stop. This is a nice feature when you're working with the Safari Web Inspector as opposed to Chrome's Developer tools.
Common ways to improve hybrid performance
With hybrid apps, we can use all the techniques for improving performance using a build system such as Grunt.js or Gulp.js with NPM, using JSLint to better optimize our code, writing code in an IDE to create better structure for our apps, and helping to check for any excess code or unused variables in our code.
We can use best performance practices such as using strings to apply an HTML page (like the innerHTML property) rather than creating objects for them and applying them to the page that way, and so on.
Sadly, the fact that hybrid apps do not perform as well as native apps still holds true. Now, don't let that dismay you as hybrid apps do have a lot of good features! Some of these are as follows:
They are (typically) faster to build than using native code
They are easier to customize
They allow for rapid prototyping concepts for apps
They are easier to hand off to other JavaScript developers rather than finding a native developer
They are portable; they can be reused for another platform (with some modification) for Android devices, Windows Modern apps, Windows Phone apps, Chrome OS, and even Firefox OS
They can interact with native code using helper libraries such as Cordova
At some point, however, application performance will be limited to the hardware of the device, and it's recommended you move to native code. But, how do we know when to move? Well, this can be done using Color Blended Layers. The Color Blended Layers option applies an overlay that highlights slow-performing areas on the device display, for example, green for good performance and red for slow performance; the darker the color is, the more impactful will be the performance result.
Rerun your app using Xcode and, in the Mac OS toolbar for iOS Simulator, select Debug and then Color Blended Layers. Once we do that, we can see that our iOS Simulator shows a green overlay; this shows us how much memory iOS is using to process our rendered view, both native and non-native code, as shown here:
Currently, we can see a mostly green overlay with the exception of the status bar elements, which take up more render memory as they overlay the web view and have to be redrawn over that object repeatedly.
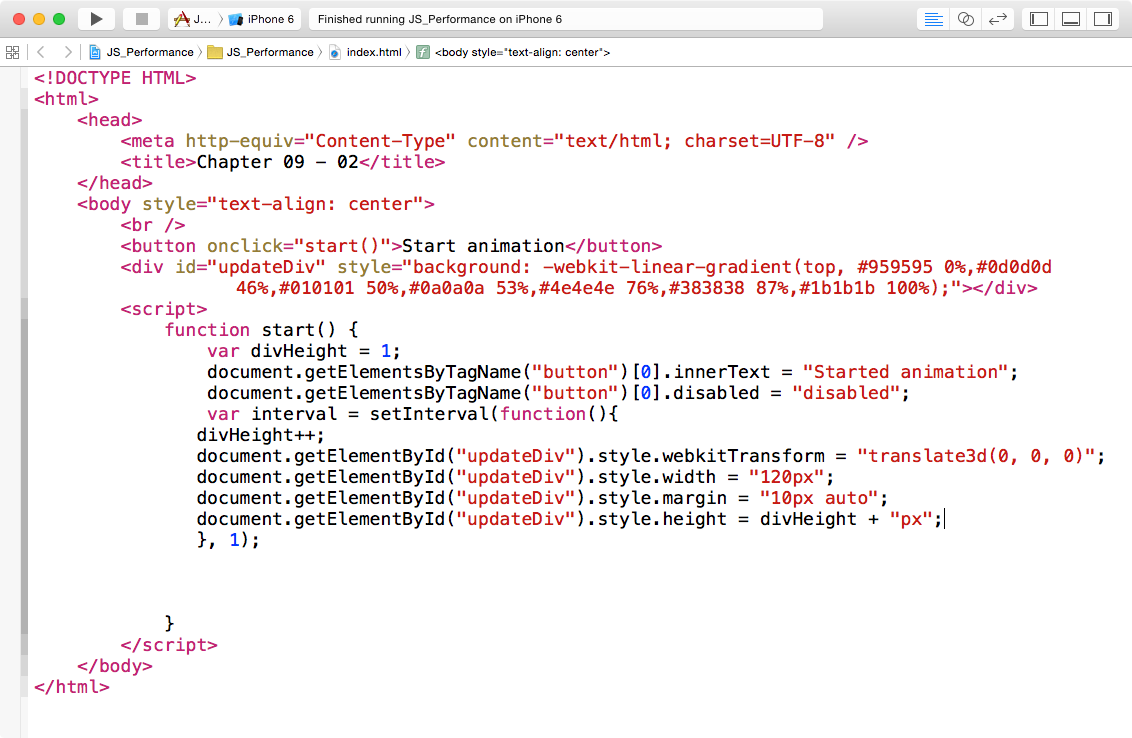
Let's make a copy of our project and call it JS_Performance_CBL, and let's update our index.html code with this code sample, as shown in the following screenshot:
Here, we have a simple page with an empty div; we also have a button with an onclick function called start. Our start function will update the height continuously using the setInterval function, increasing the height every millisecond. Our empty div also has a background gradient assigned to it with an inline style tag.
CSS background gradients are typically a huge performance drain on mobile devices as they can potentially re-render themselves over and over as the DOM updates itself. Some other issues include listener events; some earlier or lower-end devices do not have enough RAM to apply an event listener to a page. Typically, it's a good practice to apply onclick attributes to HTML either inline or through JavaScript.
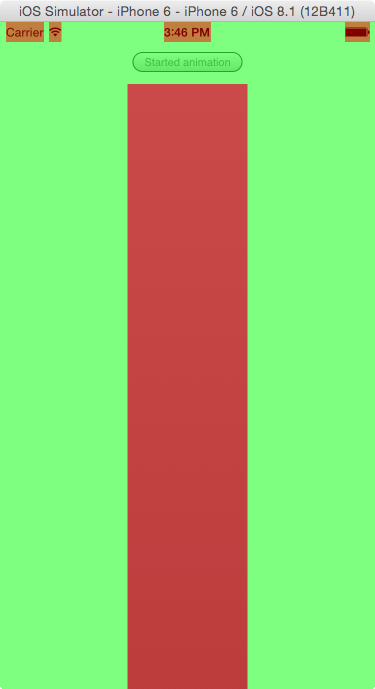
Going back to the gradient example, let's run this in iOS Simulator and enable Color Blended Layers after clicking our HTML button to trigger the JavaScript animation.
As expected, our div element that we've expanded now has a red overlay indicating that this is a confirmed performance issue, which is unavoidable. To correct this, we would need to remove the CSS gradient background, and it would show as green again. However, if we had to include a gradient in accordance with a design spec, a native version would be required.
When faced with UI issues such as these, it's important to understand tools beyond normal developer tools and Web Inspectors, and take advantage of the mobile platform tools that provide better analysis of our code. Now, before we wrap this article, let's take note of something specific for iOS web views.
The WKWebView framework
At the time of writing, Apple has announced the WebKit framework, a first-party iOS library intended to replace UIWebView with more advanced and better performing web views; this was done with the intent of replacing apps that rely on HTML5 and JavaScript with better performing apps as a whole.
The WebKit framework, also known in developer circles as WKWebView, is a newer web view that can be added to a project. WKWebView is also the base class name for this framework. This framework includes many features that native iOS developers can take advantage of. These include listening for function calls that can trigger native Objective-C or Swift code. For JavaScript developers like us, it includes a faster JavaScript runtime called Nitro, which has been included with Mobile Safari since iOS6.
Hybrid apps have always run worse that native code. But with the Nitro JavaScript runtime, HTML5 has equal footing with native apps in terms of performance, assuming that our view doesn't consume too much render memory as shown in our color blended layers example.
WKWebView does have limitations though; it can only be used for iOS8 or higher and it doesn't have built-in Storyboard or XIB support like UIWebView. So, using this framework may be an issue if you're new to iOS development. Storyboards are simply XML files coded in a specific way for iOS user interfaces to be rendered, while XIB files are the precursors to Storyboard. XIB files allow for only one view whereas Storyboards allow multiple views and can link between them too.
If you are working on an iOS app, I encourage you to reach out to your iOS developer lead and encourage the use of WKWebView in your projects.
In this article, we learned the basics of creating a hybrid-application for iOS using HTML5 and JavaScript; we learned about connecting the Safari Web Inspector to our HTML page while running an application in iOS Simulator. We also looked at Color Blended Layers for iOS Simulator, and saw how to test for performance from our JavaScript code when it's applied to device-rendering performance issues.
Now we are down to the wire. As for all JavaScript web apps before they go live to a production site, we need to smoke-test our JavaScript and web app code and see if we need to perform any final improvements before final deployment.

 United States
 Great Britain
 India
India
 Germany
 France
 Canada
 Russia
 Spain
Spain
 Brazil
 Australia
 Singapore
 Canary Islands
 Hungary
 Ukraine
 Luxembourg
 Estonia
 Lithuania
 South Korea
 Turkey
 Switzerland
 Colombia
 Taiwan
 Chile
Chile
 Norway
 Ecuador
 Indonesia
 New Zealand
 Cyprus
 Denmark
 Finland
 Poland
 Malta
Malta
 Czechia
 Austria
 Sweden
 Italy
Italy
 Egypt
Egypt
 Belgium
 Portugal
 Slovenia
 Ireland
 Romania
 Greece
 Argentina
 Netherlands
 Bulgaria
 Latvia
 South Africa
 Malaysia
 Japan
Japan
 Slovakia
 Philippines
 Mexico
 Thailand