NHibernate Profiler from Hibernating Rhinos is the number one tool for analyzing and visualizing what is happening inside your NHibernate application, and for discovering issues you may have. In this recipe, I'll show you how to get up and running with NHibernate Profiler.
Getting ready
Download NHibernate Profiler from http://nhprof.com, and unzip it. As it is a commercial product, you will also need a license file. You may request a 30-day trial license from the NHProf website.
Using our Eg.Core model, set up a new NHibernate console application with log4net. (Download code).
How to do it...
Add a reference to HibernatingRhinos.Profiler.Appender.dll from the NH Profiler download.
In the session-factory element of App.config, set the property generate_statistics to true.
var sessionFactory = nhConfig.BuildSessionFactory();
using (var session = sessionFactory.OpenSession()) { var books = from b in session.Query<Book>() where b.Author == "Jason Dentler" select b;
foreach (var book in books) Console.WriteLine(book.Name); }
Run NHProf.exe from the NH Profiler download, and activate the license.
Build and run your console application.
Check the NH Profiler. It should look like the next screenshot. Notice the gray dots indicating alerts next to the Session #1 and Recent Statements.
Select Session #1 from the Sessions list at the top left pane.
Select the statement from the top right pane.
Notice the SQL statement in the following screenshot:
Unlock access to the largest independent learning library in Tech for FREE!
Get unlimited access to 7500+ expert-authored eBooks and video courses covering every tech area you can think of.
Renews at $19.99/month. Cancel anytime
Click on See the 1 row(s) resulting from this statement.
Enter your database connection string in the field provided, and click on OK.
Close the query results window.
Switch to the Alerts tab, and notice the alert: Use of implicit transaction is discouraged.
Click on the Read more link for more information and suggested solutions to this particular issue.
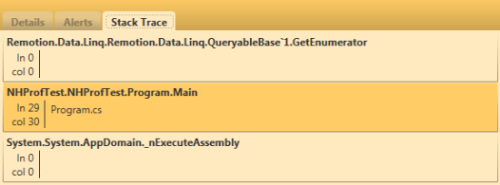
Switch to the Stack Trace tab, as shown in the next screenshot:
Double-click on the NHProfTest.NHProfTest.Program.Main stack frame to jump to that location inside Visual Studio.
Using the following code, wrap the foreach loop in a transaction and commit the transaction:
using (var tx = session.BeginTransaction()) { foreach (var book in books) Console.WriteLine(book.Name); tx.Commit(); }
In NH Profiler, right-click on Sessions on the top left pane, and select Clear All Sessions.
Build and run your application.
Check NH Profiler for alerts.
How it works...
NHibernate Profiler uses a custom log4net appender to capture data about NHibernate activities inside your application and transmit that data to the NH Profiler application.
Setting generate_statistics allows NHibernate to capture many key data points. These statistics are displayed in the lower, left-hand side of the pane of NHibernate Profiler.
We initialize NHibernate Profiler with a call to NHibernateProfiler.Initialize(). For best results, do this when your application begins, just after you have configured log4net.
There's more...
NHibernate Profiler also supports offline and remote profiling, as well as command-line options for use with build scripts and continuous integration systems.
In addition to NHibernate warnings and errors, NH Profiler alerts us to 12 common misuses of NHibernate, which are as follows:
Transaction disposed without explicit rollback or commit: If no action is taken, transactions will rollback when disposed. However, this often indicates a missing commit rather than a desire to rollback the transaction
Using a single session on multiple threads is likely a bug: A Session should only be used by one thread at a time. Sharing a session across threads is usually a bug, not an explicit design choice with proper locking.
Use of implicit transaction is discouraged: Nearly all session activity should happen inside an NHibernate transaction.
Excessive number of rows: In nearly all cases, this indicates a poorly designed query or bug.
Large number of individual writes: This indicates a failure to batch writes, either because adonet.batch_size is not set, or possibly because an Identity-type POID generator is used, which effectively disables batching.
Select N+1: This alert indicates a particular type of anti-pattern where, typically, we load and enumerate a list of parent objects, lazy-loading their children as we move through the list. Instead, we should eagerly fetch those children before enumerating the list
Superfluous updates, use inverse="true": NH Profiler detected an unnecessary update statement from a bi-directional one-to-many relationship. Use inverse="true" on the many side (list, bag, set, and others) of the relationship to avoid this.
Too many cache calls per session: This alert is targeted particularly at applications using a distributed (remote) second-level cache. By design, NHibernate does not batch calls to the cache, which can easily lead to hundreds of slow remote calls. It can also indicate an over reliance on the second-level cache, whether remote or local.
Too many database calls per session: This usually indicates a misuse of the database, such as querying inside a loop, a select N+1 bug, or an excessive number of writes.
Too many joins: A query contains a large number of joins. When executed in a batch, multiple simple queries with only a few joins often perform better than a complex query with many joins. This alert can also indicate unexpected Cartesian products.
Unbounded result set: NH Profiler detected a query without a row limit. When the application is moved to production, these queries may return huge result sets, leading to catastrophic performance issues. As insurance against these issues, set a reasonable maximum on the rows returned by each query
Different parameter sizes result in inefficient query plan cache usage: NH Profiler detected two identical queries with different parameter sizes. Each of these queries will create a query plan. This problem grows exponentially with the size and number of parameters used. Setting prepare_sql to true allows NHibernate to generate queries with consistent parameter sizes.

 United States
 Great Britain
 India
India
 Germany
 France
 Canada
 Russia
 Spain
Spain
 Brazil
 Australia
 Singapore
 Canary Islands
 Hungary
 Ukraine
 Luxembourg
 Estonia
 Lithuania
 South Korea
 Turkey
 Switzerland
 Colombia
 Taiwan
 Chile
Chile
 Norway
 Ecuador
 Indonesia
 New Zealand
 Cyprus
 Denmark
 Finland
 Poland
 Malta
Malta
 Czechia
 Austria
 Sweden
 Italy
Italy
 Egypt
Egypt
 Belgium
 Portugal
 Slovenia
 Ireland
 Romania
 Greece
 Argentina
 Netherlands
 Bulgaria
 Latvia
 South Africa
 Malaysia
 Japan
Japan
 Slovakia
 Philippines
 Mexico
 Thailand