Microsoft SharePoint 2010 Administration: Monitoring and Reporting
Read more
Microsoft SharePoint 2010 Administration: Monitoring and Reporting
Packt
420 min read
2011-01-31 00:00:00
0 Likes
0 Comments
SharePoint 2010 has been architected to be a proactive system that provides many tools to the administrators. The goal is to catch issues before they occur. If they do occur, the system should give the administrator the capability to debug the issues with the least amount of resistance.
One example of this is the new logging database. It collects information from disparate servers and collates this information into the database. For instance, the Unified Logging Service (ULS) logs collect information that is useful in troubleshooting issues. These logs are found on every SharePoint Server. These ULS logs are collected from all servers and the event logs. This makes the logging database a valuable tool. It is must-have knowledge for SharePoint administrators and covered in one of the recipes.
Reporting is another area where SharePoint 2010 has been given focus. Reports are more robust and present better information down at the site level. This gives administrators a better idea about how their site is being utilized, what they are searching for, and uncovers where functionality is lacking.
When it comes to monitoring and being proactive, SharePoint offers another level of service — self-correcting health monitoring. SharePoint 2010 health monitoring jobs have the ability to uncover issues, report them, and then SharePoint is able to automatically correct the issue (in some cases).
Finally, SharePoint 2010 delivers a tool that can give details on the performance of a page. Currently, we have to use a tool such as Microsoft Visual Round Trip Analyzer. This is now an innate built-in capability of the infrastructure. The last recipe in this chapter shows how to use this tool.
The monitoring and reporting capabilities combined together empower the administrator to be proactive with regards to the health of the SharePoint farm. These capabilities can be leveraged with other SharePoint functions such as alerts, so that the team managing the SharePoint farm should be well versed in the performance of the installation.
Accessing the SharePoint 2010 logging database
As mentioned in the introduction, the SharePoint 2010 logging database is a major enhancement to monitoring, debugging, and protecting the health of the farm.
By default, the database is called WSS_Logging . This database should be the starting point for administrators to collect and analyze information.
In this recipe, we will access the database and run a view (that already is installed) against it.
Getting ready
You must have farm-level administrative permissions to the Central Administration site. You must have read and execute permissions as well to the WSS_Logging database in order to open and execute views.
How to do it...
Open up SQL Server Management Studio.
When asked for authentication, log in to the correct instance where SharePoint is running using your windows authentication credentials. If SQL authentication is the preferred method of connecting, use the appropriate User ID/Password.
Navigate to the WSS_Logging database and click on the plus sign to expand it.
Under the toolbar at the top, click on the New Query button.
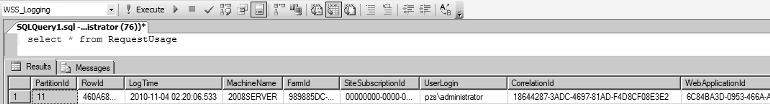
In the new query window, type in the following query: Select * from RequestUsage.
Click Execute. Results are populated in the window pane below the query, as seen in the following screenshot:
How it works...
In the above recipe a view called RequestUsage was executed. This is an out of the box view that provides site usage information. It provides information such as the referring URL, the browser being used, the site ID, the web ID, the server URL, the request type, and when it was done.
The logging database contains, but is not limited to, the following information:
It is a place where information is aggregated from across the farm. For instance, all ULS logs, from every SharePoint server, are collected within this database.
There are 26 views installed by default. However, the purpose of this database is to give administrators and developers a place to log information based on processes. These are typically custom processes. Views can be created to meet an organization's needs.
There's more...
The location of the logging database is not a setting that can be done through the user interface in Central Administration. Because of all the data that is collected in this database, it can grow quite large. Additionally, as SharePoint-integrated applications are created, developers can utilize this database to communicate issues.
Therefore, due to size and usage, it is a wise idea to move the database to another physical location such as a dedicated disk. This can be done only via PowerShell, using the following command:
The ULS logs are present on every WFE. It is important for an Administrator to know where to find these logs manually. They are located at the following location: Common FilesMicrosoft SharedWeb Server Extensions14Logs.
Configuring what gets logged
The SharePoint 2010 logging database covered in the previous recipe captures information that can be modified via the Central Administration interface. The advantage of this being that the collection of information can be voluminous, which can also be the disadvantage.
Disk space, I/O, and just the amount of data needed to retain this information can become an issue. Being able to reduce the type of information that gets captured is critical to the wellness of your farm.
In this recipe, we will cover how to change what gets captured and put into the logging database.
Getting ready
You must have farm-level administrative permissions to the Central Administration site.
Unlock access to the largest independent learning library in Tech for FREE!
Get unlimited access to 7500+ expert-authored eBooks and video courses covering every tech area you can think of.
Renews at $19.99/month. Cancel anytime
How to do it...
Open the SharePoint 2010 Central Administration website.
Click Monitoring.
Under the Reporting section, click Configure usage and health data collection.
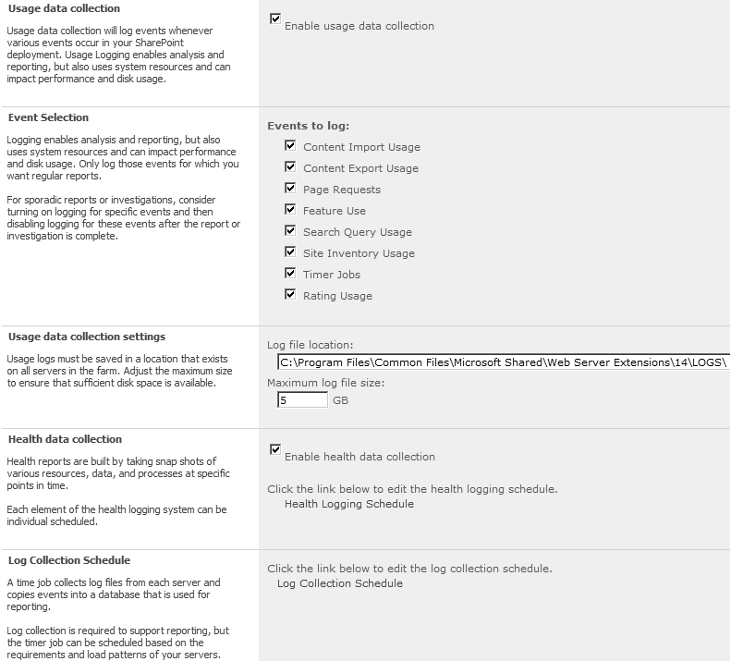
The following form appears for configuration:
Fill in the following details:
Usage Data Collection: This is enabled by default.
Event Selection: These are specific events that are being logged. Use the check box to enable or disable them.
Usage data collection settings: In this section, the location of the ULS logs are set. Also, there is a setting to limit the size of the log file.
Health data collection: This is enabled by default.
Log Collection Schedule: Administrator has the ability to change the schedule.
Modify the settings in step 4 and click OK.
How it works...
The options presented in the usage and health data collection are logged to the logging database and to the ULS logs.
The health logging schedule can be modified to fit the needs (also known as Service Level Agreements) of your organization. It is important to remember that there is a hidden cost associated with the increased logging. The hidden cost is mainly in the form of storage and possibly performance.
The ULS logs have the potential to grow large. The logs can be moved to a new physical location (physical spindle), which does not contain the operating system or WFE/Application server software. The physical location reference must exist on all servers in the farm.
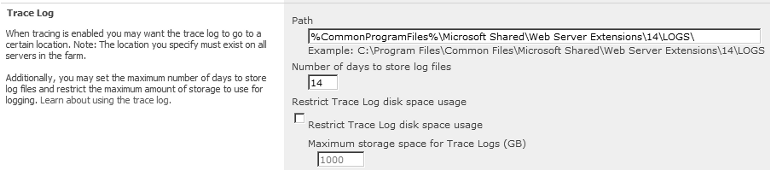
The location of the logs is set within Central Administration. To access the setting, go to Central Administration, click Monitoring, and then select Configure diagnostic logging. Under the Trace Log section is the Path. This contains the location of the ULS logs.
There's more...
The logging information is retained for a period of 14 days by default. Using PowerShell you can change this parameter, using the following command:

 United States
 Great Britain
 India
India
 Germany
 France
 Canada
 Russia
 Spain
Spain
 Brazil
 Australia
 Singapore
 Canary Islands
 Hungary
 Ukraine
 Luxembourg
 Estonia
 Lithuania
 South Korea
 Turkey
 Switzerland
 Colombia
 Taiwan
 Chile
Chile
 Norway
 Ecuador
 Indonesia
 New Zealand
 Cyprus
 Denmark
 Finland
 Poland
 Malta
Malta
 Czechia
 Austria
 Sweden
 Italy
Italy
 Egypt
Egypt
 Belgium
 Portugal
 Slovenia
 Ireland
 Romania
 Greece
 Argentina
 Netherlands
 Bulgaria
 Latvia
 South Africa
 Malaysia
 Japan
Japan
 Slovakia
 Philippines
 Mexico
 Thailand