


How many times we have heard of organization’s entire database being breached and downloaded by the hackers. The irony is, they are not even aware about anything until the hacker is selling the database details on the dark web after few months.
Even though they implement decent security controls, what they lack is continuous security monitoring policy. It is one of the most common things that you might find in a startup or mid-sized organization.
In this article, we will show how to choose the right log monitoring tool to implement continuous security monitoring policy.
You are reading an excerpt from the book Enterprise Cloud Security and Governance, written by Zeal Vora.
Log monitoring is a must in security
Log monitoring is considered to be part of the de facto list of things that need to be implemented in an organization. It gives us the power of visibility of various events through a single central solution so we don’t have to end up doing less or tail on every log file of every server.
In the following screenshot, we have performed a new search with the keyword not authorized to perform and the log monitoring solution has shown us such events in a nice graphical way along with the actual logs, which span across days:

Thus, if we want to see how many permission denied events occurred last week on Wednesday, this will be a 2-minute job if we have a central log monitoring solution with search functionality.
This makes life much easier and would allow us to detect anomalies and attacks in a much faster than traditional approach.
Choosing the right log monitoring tool
This is a very important decision that needs to be taken by the organization. There are both commercial offerings as well as open source offerings that are available today but the amount of efforts that need to be taken in each of them varies a lot.
I have seen many commercial offerings such as Splunk and ArcSight being used in large enterprises, including national level banks. On the contrary, there are also open source offerings, such as ELK Stack, that are gaining popularity especially after Filebeat got introduced.
At a personal level, I really like Splunk but it gets very expensive when you have a lot of data being generated. This is one of the reasons why many startups or mid-sized organizations use commercial offering along with open source offerings such as ELK Stack.
Having said that, we need to understand that if you decide to go with ELK Stack and have a large amount of data, then ideally you would need a dedicated person to manage it.
Just to mention, AWS also has a basic level of log monitoring capability available with the help of CloudWatch.
Let’s get started with logging and monitoring
There will always be many sources from which we need to monitor logs. Since it will be difficult to cover each and every individual source, we will talk about two primary ones, which we will be discussing sequentially:
- VPC flow logs
- AWS Config
VPC flow logs
VPC flow logs is a feature that allows us to capture information related to IP traffic that goes to and from the network interfaces within the VPC.
VPC flow logs help in both troubleshooting related to why certain traffic is not reaching the EC2 instances and also understanding what the traffic is that is accepted and rejected.
The VPC flow logs can be part of individual network interface level of an EC2 instance. This allows us to monitor how many packets are accepted or rejected in a specific EC2 instance running in the DMZ maybe.
By default, the VPC flow logs are not enabled, so we will go ahead and enable the VPC flow log within our VPC:
- Enabling flow logs for VPC:
- In our environment, we have two VPCs named Development and Production. In this case, we will enable the VPC flow logs for development VPC:

-
- In order to do that, click on the Development VPC and select the Flow Logs tab.
- This will give you a button named Create Flow Log.
- Click on it and we can go ahead with the configuration procedure:

-
- Since the VPC flow logs data will be sent to CloudWatch, we need to select the IAM Role that gives these permissions:

Before we go ahead in creating our first flow log, we need to create the CloudWatch log group as well where the VPC flow logs data will go into.
-
- In order to do it, go to CloudWatch, select the Logs tab.
- Name the log group according to what you need and click on Create log group:

-
- Once we have created our log group, we can fill the Destination Log Group field with our log group name and click on the Create Flow Log button:

-
- Once created, you will see the new flow log details under the VPC subtab:

- Create a test setup to check the flow:
- In order to test if everything is working as intended, we will start our test OpenVPN instance and in the security group section, allow inbound connections on port 443 and icmp (ping). This gives us the perfect base for a plethora of attackers detecting our instance and running a plethora of attacks on our server:

- Analyze flow logs in CloudWatch:
- Before analyzing for flow logs, I went for a small walk so that we can get a decent number of logs when we examine; thus, when I returned, I began analyzing the flow logs data. If we observe the flow log data, we see plenty of packets, which have REJECT OK at the end as well as ACCEPT OK.
- Flow logs can be unto specific interface levels, which are attached to EC2 instances. So, in order to check the flow logs, we need to go to CloudWatch, select the Log Groups tab, inside it select the log group that we created and then select the interface. In our case, we selected the interface related to the OpenVPN instance, which we had started:
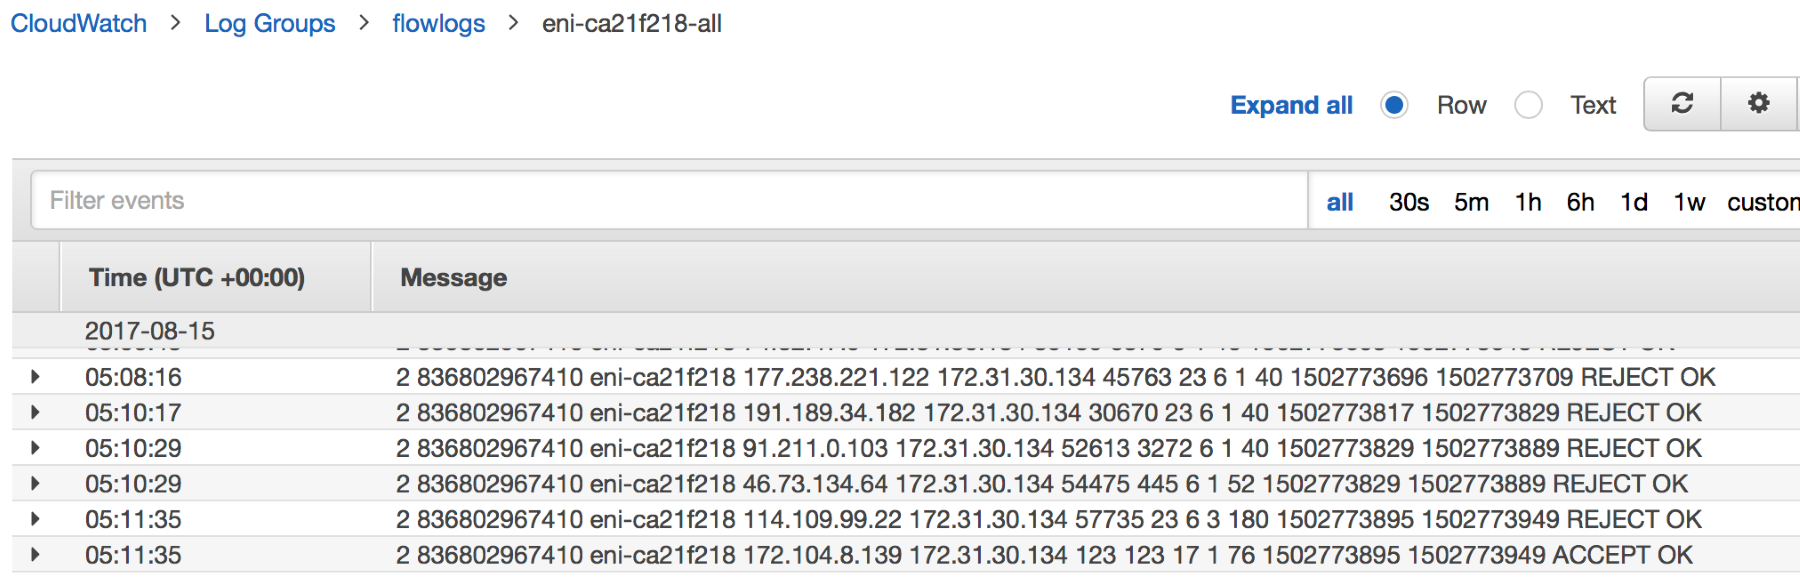
CloudWatch gives us the capability to filter packets based on certain expressions. We can filter all the rejected packets by creating a simple search for REJECT OK in the search bar and CloudWatch will give us all the traffic that was rejected. This is shown in the following image:

- Viewing the logs in GUI:
Plain text data is good but it’s not very appealing and does not give you deep insights about what exactly is happening. It’s always preferred to send these logs to a Log Monitoring tool, which can give you deep insights about what exactly is happening.
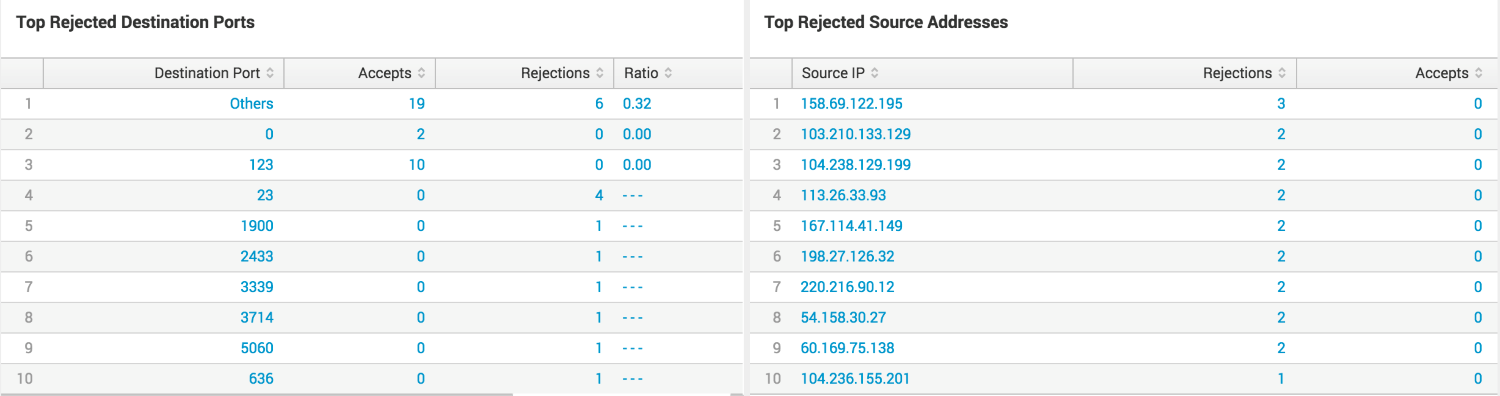
In my case, I have used Splunk to give us an overview about the logs in our environment. When we look into VPC Flow Logs, we see that Splunk gives us great detail in a very nice GUI and also maps the IP addresses to the location from which the traffic is coming:

The following image is the capture of VPC flow logs which are being sent to the Splunk dashboard for analyzing the traffic patterns:

AWS Config
AWS Config is a great service that allows us to continuously assess and audit the configuration of the AWS-related resources.
With AWS Config, we can exactly see what configuration has changed from the previous week to today for services such as EC2, security groups, and many more.
One interesting feature that Config allows is to set the compliance test as shown in the following screenshots. We see that there is one rule that is failing and is considered non-compliant, which is the CloudTrail.
There are two important features that Config service provides:
- Evaluate changes in resources over the timeline
- Compliance checks
Once they are enabled and you have associated Config rules accordingly, then you would see a dashboard similar to the following screenshot:

In the preceding screenshot, on the left-hand side, Config gives details related to the Resources, which are present in your AWS; and on the right-hand column, Config gives us the status if the resources are compliant or non-compliant according to the rules that are set.
Configuring the AWS Config service
Let’s look into how we can get started with the AWS Config service and have great dashboards along with compliance checks, which we saw in the previous screenshot:
- Enabling the Config service: The first time when we want to start working with Config, we need to select the resources we want to evaluate. In our case, we will select both the region-specific resources as well as global resources such as IAM:

- Configure S3 and IAM: Once we decide to include all the resources, the next thing is to create an Amazon S3 bucket where AWS Config will store the configuration and snapshot files. We will also need to select IAM role, which will allow Config into put these files to the S3 bucket:

- Select Config rules: Configuration rules are checks against your AWS resources, which can be done and the result will be part of the compliance standard.
For example, root-account-mfa-enabled rule will check whether the ROOT account has MFA enabled or disabled and in the end it will give you a nice graphical overview about the output of the checks conducted by the rules.
Currently, there are 38 AWS-managed rules, which we can select and use anytime; however, we can have custom rules anytime as well. For our case, I will use five specific rules, which are as follows:- cloudtrail-enabled
- iam-password-policy
- restricted-common-ports
- restricted-ssh
- root-account-mfa-enabled

- Config initialization: With the Config rules selected, we can click on Finish and AWS Config will start, and it will start to check resources and its associated rules.
You might get the dashboard similar to the following screenshot, which speaks about the available resources as well as the rule compliance related graphs:

Let’s analyze the functionality
For demo purposes, I decided to disable the CloudTrail service and if we then look into the Config dashboard, it says that one rule check has been failed:

Instead of graphs, Config can also show the resources in a tabular manner if we want to inspect the Config rules with the associated names. This is illustrated in the following diagram:

Evaluating changes to resources
AWS Config allows us to evaluate the configuration changes that have been made to the resources. This is a great feature that allows us to see how our resource looked a day, a week, or even months back.
This feature is particularly useful specifically during incidents when, during investigation, one might want to see what exactly changed before the incident took place. It will help things go much faster.
In order to evaluate the changes, we will need to perform the following steps:
- Go to AWS Config | Resources. This will give you the Resource inventory page in which you can either search for resources based on the resource type or based on tags. For our use case, I am searching for a tag value for an EC2 Instance whose name is OpenVPN:

- When we go inside the Config timeline, we see the overall changes that have been made to the resource. In the following screenshot, we see that there were a few changes that were made, and Config also shows us the time the changes that were made to the resource:

- When we click on Changes, it will give you the exact detail on what was the exact change that was made. In our case, it is related to the new network interface, which was attached to the EC2 instance. It displays the network interface ID, description along with the IP address, and the security group, which is attached to that network interface:

- When we start to integrate the AWS services with Splunk or similar monitoring tools, we can get great graphs, which will help us evaluate things faster. On the side, we always have the logs from the CloudTrail, if we want to see the changes that occurred in detail.
We covered log monitoring and how to choose the right log monitoring tool for continuous security monitoring policy. Check out the book Enterprise Cloud Security and Governance to build resilient cloud architectures for tackling data disasters with ease.
Read Next:
Cloud Security Tips: Locking Your Account Down with AWS Identity Access Manager (IAM)