


In this article by Andrew Minteer, author of the book Analytics for the Internet of Things (IoT), that you understand how your data is transmitted back to the corporate servers, you feel you have more of a handle on it. You also have a reference frame in your head on how it is operating out in the real world.
(For more resources related to this topic, see here.)
Your boss stops by again.
“Is that rolling average job done running yet?”, he asks impatiently.
It used to run fine and finished in an hour three months ago. It has steadily taken longer and longer and now sometimes does not even finish. Today, it has been going on six hours and you are crossing your fingers. Yesterday it crashed twice with what looked like out of memory errors.
You have talked to your IT group and finance group about getting a faster server with more memory. The cost would be significant and likely will take months to complete the process of going through purchasing, putting it on order, and having it installed. Your friend in finance is hesitant to approve it. The money was not budgeted for this fiscal year. You feel bad especially since this is the only analytic job causing you problems. It just runs once a month but produces key data.
Not knowing what else to say, you give your boss a hopeful, strained smile and show him your crossed fingers.
“It’s still running…that’s good, right?”
This article is about the advantages to cloud based infrastructure for handling and analyzing IoT data. We will discuss cloud services including Amazon Web Services (AWS), Microsoft Azure, and Thingworx. You will learn how to implement analytics elastically to enable a wide variety of capabilities.
This article will cover:
- Building elastic analytics
- Designing for scale
- Cloud security and analytics
- Key Cloud Providers
- Amazon AWS
- Microsoft Azure
- PTC ThingWorx
Building elastic analytics
IoT data volumes increase quickly. Analytics for IoT is particularly compute intensive at times that are difficult to predict. Business value is uncertain and requires a lot of experimentation to find the right implementation.
Combine all that together and you need something that scales quickly, is dynamic and responsive to resource needs, and virtually unlimited capacity at just the right time. And all of that needs to be implemented quickly with a low cost and low maintenance needs.
Enter the cloud. IoT Analytics and cloud infrastructure fit together like a hand in a glove.
What is the cloud infrastructure?
The National Institute of Standards and Technology defines five essential characteristics:
- On-demand self-service: You can provision things like servers and storage as needed and without interacting with someone.
- Broad network access: Your cloud resources are accessible over the internet (if enabled) by various methods such as web browser or mobile phone.
- Resource pooling: Cloud providers pool their servers and storage capacity across many customers using a multi-tenant model. Resources, both physical and virtual, are dynamically assigned and reassigned as needed. Specific location of resources is unknown and generally unimportant.
- Rapid elasticity: Your resources can be elastically created and destroyed. This can happen automatically as needed to meet demand. You can scale outward rapidly. You can also contract rapidly. Supply of resources is effectively unlimited from your viewpoint.
- Measured service: Resource usage is monitored, controlled, and reported by the cloud provider. You have access to the same information, providing transparency to your utilization. Cloud systems continuously optimize resources automatically.
There is a notion of private clouds that exist on premises or custom built by a third party for a specific organization. For our concerns, we will be discussing public clouds only. By and large, most analytics will be done on public clouds so we will concentrate our efforts there.
The capacity available at your fingertips on public clouds is staggering. AWS, as of June 2016, has an estimated 1.3 million servers online. These servers are thought to be three times more efficient than enterprise systems.
Cloud providers own the hardware and maintain the network and systems required for the available services. You just have to provision what you need to use, typically through a web application.
Providers offer different levels of abstractions. They offer lower level servers and storage where you have fine grained control. They also offer managed services that handle the provisioning of servers, networking, and storage for you. These are used in conjunction with each other without much distinction between the two.
Hardware failures are handled automatically. Resources are transferred to new hardware and brought back online. The physical components become unimportant when you design for the cloud, it is abstracted away and you can focus on resource needs.
The advantages to using the cloud:
- Speed: You can bring cloud resources online in minutes.
- Agility: The ability to quickly create and destroy resources leads to ease of experimentation. This increases the agility of analytics organizations.
- Variety of services: Cloud providers have many services available to support analytics workflows that can be deployed in minutes. These services manage hardware and storage needs for you.
- Global reach: You can extend the reach of analytics to the other side of the world with a few clicks.
- Cost control: You only pay for the resources you need at the time you need them. You can do more for less.
To get an idea of the power that is at your fingertips, here is an architectural diagram of something NASA built on AWS as part of an outreach program to school children.
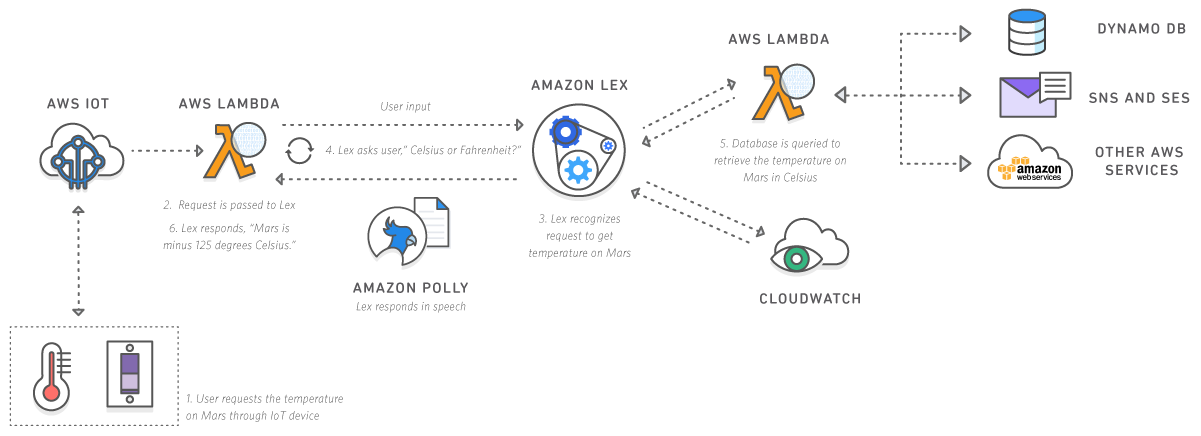
By speaking voice commands, it will communicate with a Mars Rover replica to retrieve IoT data such as temperature readings. The process includes voice recognition, natural speech generation from text, data storage and processing, interaction with IoT device, networking, security, and ability to send text messages. This was not a years worth of development effort, it was built by tying together cloud based services already in place.
And it is not just for big, funded government agencies like NASA. All of these services and many more are available to you today if your analytics runs in the cloud.
Elastic analytics concepts
What do we mean by Elastic Analytics? Let’s define it as designing your analytics processes so scale is not a concern. You want your focus to be on the analytics and not on the underlying technology. You want to avoid constraining your analytics capability so it will fit within some set hardware limitations. Focus instead on potential value versus costs. Trade hardware constraints for cost constraints.
You also want your analytics to be able to scale. It should go from supporting 100 IoT devices to 1 Million IoT devices without requiring any fundamental changes. All that should happen if the costs increase.
This reduces complexity and increases maintainability. That translates into lower costs which enables you to do more analytics. More analytics increases the probability of finding value. Finding more value enables even more analytics. Virtuous circle!
Some core Elastic Analytics concepts:
- Separate compute from storage: We are used to thinking about resources like laptop specifications. You buy one device that has 16GB memory and 500GB hard drive because you think that will meet 90% of your needs and it is the top of your budget. Cloud infrastructure abstracts that away. Doing analytics in the cloud is like renting a magic laptop where you can change 4GB memory into 16GB by snapping your fingers. Your rental bill increases for only the time you have it at 16GB. You snap your fingers again and drop it back down to 4GB to save some money. Your hard drive can grow and shrink independently of the memory specification. You are not stuck having to choose a good balance between them. You can match compute needs with requirements.
- Build for scale from the start: Use software, services, and programming code that can scale from 1 to 1 million without changes. Each analytic process you put in production has continuing maintenance efforts to it that will build up over time as you add more and more. Make it easy on yourself later on. You do not want to have to stop what you are doing to re-architect a process you built a year ago because it hit limits of scale.
- Make your bottleneck wetware not hardware: By wetware, we mean brain power. “My laptop doesn’t have enough memory to run the job” should never be the problem. It should always be “I haven’t figured it out yet, but I have several possibilities in test as we speak.”
- Manage to a spend budget not to available hardware: Use as many cloud resources as you need as long as it fits within your spend budget. There is no need to limit analytics to fit within a set number of servers when you run analytics in the cloud. Traditional enterprise architecture purchases hardware ahead of time which incurs a capital expense. Your finance guy does not (usually) like capital expense. You should not like it either, as it means a ceiling has just been set on what you can do (at least in the near term). Managing to spend means keeping an eye on costs, not on resource limitations. Expand when needed and make sure to contract quickly to keep costs down.
- Experiment, experiment, experiment: Create resources, try things out, kill them off if it does not work. Then try something else. Iterate to the right answer. Scale out resources to run experiments. Stretch when you need to. Bring it back down when you are done.
If Elastic Analytics is done correctly, you will find your biggest limitations are Time and Wetware. Not hardware and capital.
Design with the endgame in mind
Consider how the analytics you develop in the cloud would end up if successful. Would it turn into a regularly updated dashboard? Would it be something deployed to run under certain conditions to predict customer behavior? Would it periodically run against a new set of data and send an alert if an anomaly is detected?
When you list out the likely outcomes, think about how easy it would be to transition from the analytics in development to the production version that will be embedded in your standard processes. Choose tools and analytics that make that transition quick and easy.
Designing for scale
Following some key concepts will help keep changes to your analytics processes to a minimum, as your needs scale.
Decouple key components
Decoupling means separating functional groups into components so they are not dependent upon each other to operate. This allows functionality to change or new functionality to be added with minimal impact on other components.
Encapsulate analytics
Encapsulate means grouping together similar functions and activity into distinct units. It is a core principle of object oriented programming and you should employ it in analytics as well. The goal is to reduce complexity and simplify future changes.
As your analytics develop, you will have a list of actions that is either transforming the data, running it through a model or algorithm, or reacting to the result. It can get complicated quickly. By encapsulating the analytics, it is easier to know where to make changes when needed down the road. You will also be able reconfigure parts of the process without affecting the other components.
Encapsulation process is carried out in the following steps:
- Make a list of the steps.
- Organize them into groups.
- Think which groups are likely to change together.
- Separate the groups that are independent into their own process
It is a good idea to have the data transformation steps separate from the analytical steps if possible. Sometimes the analysis is tightly tied to the data transformation and it does not make sense to separate, but in most cases it can be separated. The action steps based on the analysis results almost always should be separate.
Each group of steps will also have its own resource needs. By encapsulating them and separating the processes, you can assign resources independently and scale more efficiently where you need it. You can do more with less.
Decouple with message queues
Decoupling encapsulated analytics processes with message queues has several advantages. It allows for change in any process without requiring the other ones to adjust. This is because there is no direct link between them.
It also builds in some robustness in case one process has a failure. The queue can continue to expand without losing data while the down process restarts and nothing will be lost after things get going again.
What is a message queue?

New data comes into a queue as a message, it goes into line for delivery, and then is delivered to the end server when it gets its turn. The process adding a message is called the publisher and the process receiving the message is called the subscriber.
The message queue exists regardless of if the publisher or subscriber is connected and online. This makes it robust against intermittent connections (intentional or unintentional). The subscriber does not have to wait until the publisher is willing to chat and vice versa.
The size of the queue can also grow and shrink as needed. If the subscriber gets behind, the queue just grows to compensate until it can catch up. This can be useful if there is a sudden burst in messages by the publisher. The queue will act as a buffer and expand to capture the messages while the subscriber is working through the sudden influx.
There is a limit, of course. If the queue reaches some set threshold, it will reject (and you will most likely lose) any incoming messages until the queue gets back under control.
A contrived but real world example of how this can happen:
Joe Cut-rate (the developer): Hey, when do you want this doo-hickey device to wake up and report?
Jim Unawares (the engineer): Every 4 hours
Joe Cut-rate: No sweat. I’ll program it to start at 12am UTC, then every 4 hours after. How many of these you gonna sell again?
Jim Unawares: About 20 million
Joe Cut-rate: Um….friggin awesome! I better hardcode that 12am UTC then, huh?
4 months later
Jim Unawares: We’re only getting data from 10% of the devices. And it is never the same 10%. What the heck?
Angela the analyst: Every device in the world reports at exactly the same time, first thing I checked. The message queues are filling up since our subscribers can’t process that fast, new messages are dropped. If you hard coded the report time, we’re going to have to get the checkbook out to buy a ton of bandwidth for the queues. And we need to do it NOW since we are losing 90% of the data every 4 hours. You guys didn’t do that, did you?
Although queues in practice typically operate with little lag, make sure the origination time of the data is tracked and not just the time the data was pulled off the queue. It can be tempting to just capture the time the message was processed to save space but that can cause problems for your analytics.
Why is this important for analytics? If you only have the date and time the message was received by the subscribing server, it may not be as close as you think to the time the message was generated at the originating device. If there are recurring problems with message queues, the spread in time difference would ebb and flow without you being aware of it.
You will be using time values extensively in predictive modeling. If the time values are sometimes accurate and sometimes off, the models will have a harder time finding predictive value in your data.
Your potential revenue from repurposing the data can also be affected. Customers are unlikely to pay for a service tracking event times for them if it is not always accurate. There is a simple solution. Make sure the time the device sends the data is tracked along with the time the data is received. You can monitor delivery times to diagnose issues and keep a close eye on information lag times. For example, if you notice the delivery time steadily increases just before you get a data loss, it is probably the message queue filling up. If there is no change in delivery time before a loss, it is unlikely to be the queue.
Another benefit to using the cloud is (virtually) unlimited queue sizes when use a managed queue service. This makes the situation described much less likely to occur.
Distributed computing
Also called cluster computing, distributed computing refers to spreading processes across multiple servers using frameworks that abstract the coordination of each individual server. The frameworks make it appear as if you are using one unified system. Under the covers, it could be a few servers (called nodes) to thousands. The framework handles that orchestration for you.
Avoid containing analytics to one server
The advantage to this for IoT analytics is in scale. You can add resources by adding nodes to the cluster, no change to the analytics code is required.
Try and avoid containing analytics to one server (with a few exceptions). This puts a ceiling on scale.
When to use distributed and when to use one server
There is a complexity cost to distributed computing though. It is not as simple as single server analytics. Even though the frameworks handle a lot of the complexity for you, you still have to think and design your analytics to work across multiple nodes.
Some guidelines on when to keep it simple on one server:
- There is not much need for scale: Your analytics needs little change even if the number of IoT devices and data explodes. For example, the analytics runs a forecast on data already summarized by month. The volume of devices makes little difference in that case.
- Small data instead of big data: The analytics runs on a small subset of data without much impact from data size. Analytics on random samples is an example.
- Resource needs are minimal: Even at orders of magnitude more data, you are unlikely to need more than what is available with a standard server. In that case, keep it simple.
Assuming change is constant
The world of IoT analytics moves quickly. The analytics you create today will change many times over as you get feedback on results and adapt to changing business conditions. Your analytics processes will need to change. Assume this will happen continuously and design for change. That brings us to the concept of continuous delivery.
Continuous delivery is a concept from software development. It automates the release of code into production. The idea is to make change a regular process. Bring this concept into your analytics by keeping a set of simultaneous copies that you use to progress through three stages:
- Development: Keep a copy of your analytics for improving and trying out new things.
- Test: When ready, merge your improvements into this copy where the functionality stays the same but it is repeatedly tested. The testing ensures it is working as intended. Keeping a separate copy for test allows development to continue on other functionality.
- Master: This is the copy that goes into production. When you merge things from test to the Master copy, it is the same as putting it into live use. Cloud providers often have a continuous delivery service that can make this process simpler.
For any software developer readers out there, this is a simplification of the Git Flow method, which is a little outside the scope of this article. If the author can drop a suggestion, it is worth some additional research to learn Git Flow and apply it to your analytics development in the cloud.
Leverage managed services
Cloud infrastructure providers, like AWS and Microsoft Azure, offer services for things like message queues, big data storage, and machine learning processing. The services handle the underlying resource needs like server and storage provisioning and also network requirements. You do not have to worry about how this happens under the hood and it scales as big as you need it.
They also manage global distribution of services to ensure low latency. The following image shows the AWS regional data center locations combined with the underwater internet cabling.

This reduces the amount of things you have to worry about for analytics. It allows you to focus more on the business application and less on the technology. That is a good thing and you should take advantage of it.
An example of a managed service is Amazon Simple Queue Service (SQS). SQS is a message queue where the underlying server, storage, and compute needs is managed automatically by AWS systems. You only need to setup and configure it which takes just a few minutes.
Summary
In this article, we reviewed what is meant by elastic analytics and the advantages to using cloud infrastructure for IoT analytics. Designing for scale was discussed along with distributed computing.
The two main cloud providers were introduced, Amazon Web Services and Microsoft Azure. We also reviewed a purpose built software platform, ThingWorx, made for IoT devices, communications, and analysis.
Resources for Article:
Further resources on this subject:
- Building Voice Technology on IoT Projects [article]
- IoT and Decision Science [article]
- Introducing IoT with Particle’s Photon and Electron [article]