Data science is a field that’s complex and diverse. If you’re trying to learn data science and become a data scientist it can be easy to fall down a rabbit hole of machine learning or data processing.
To a certain extent, that’s good. To be an effective data scientist you need to be curious. You need to be prepared to take on a range of different tasks and challenges.
But that’s not always that efficient: if you want to learn quickly and effectively, you need a clear structure - a curriculum - that you can follow.
This post will show you what you need to learn and how to go about it.
Statistics
Statistics is arguably the cornerstone of data science. Nate Silver called data scientists “sexed up statisticians”, a comment that was perhaps unfair but still nevertheless contains a kernel of truth in it: that data scientists are always working in the domain of statistics.
Once you understand this everything else you need to learn will follow easily. Machine learning, data manipulation, data visualization - these are all ultimately technological methods for performing statistical analysis really well.
Best Packt books and videos content for learning statistics
Before you go any deeper into data science, it’s critical that you gain a solid foundation in statistics.
Data mining and wrangling
This is an important element of data science that often gets overlooked with all the hype about machine learning. However, without effective data collection and cleaning, all your efforts elsewhere are going to be pointless at best. At worst they might even be misleading or problematic.
Sometimes called data manipulation or data munging, it's really all about managing and cleaning data from different sources so it can be used for analytics projects.
To do it well you need to have a clear sense of where you want to get to - do you need to restructure the data? Sort or remove certain parts of a data set? Once you understand this, it’s much easier to wrangle data effectively.
Data mining and wrangling tools
There are a number of different tools you can use for data wrangling. Python and R are the two key programming languages, and both have some useful tools for data mining and manipulation. Python in particular has a great range of tools for data mining and wrangling, such as pandas and NLTK (Natural Language Toolkit), but that isn’t to say R isn’t powerful in this domain.
Other tools are available too - Weka and Apache Mahout, for example, are popular. Weka is written in Java so is a good option if you have experience with that programming language, while Mahout integrates well with the Hadoop ecosystem.
Data mining and data wrangling books and videos
If you need to learn data mining, wrangling and manipulation, Packt has a range of products.
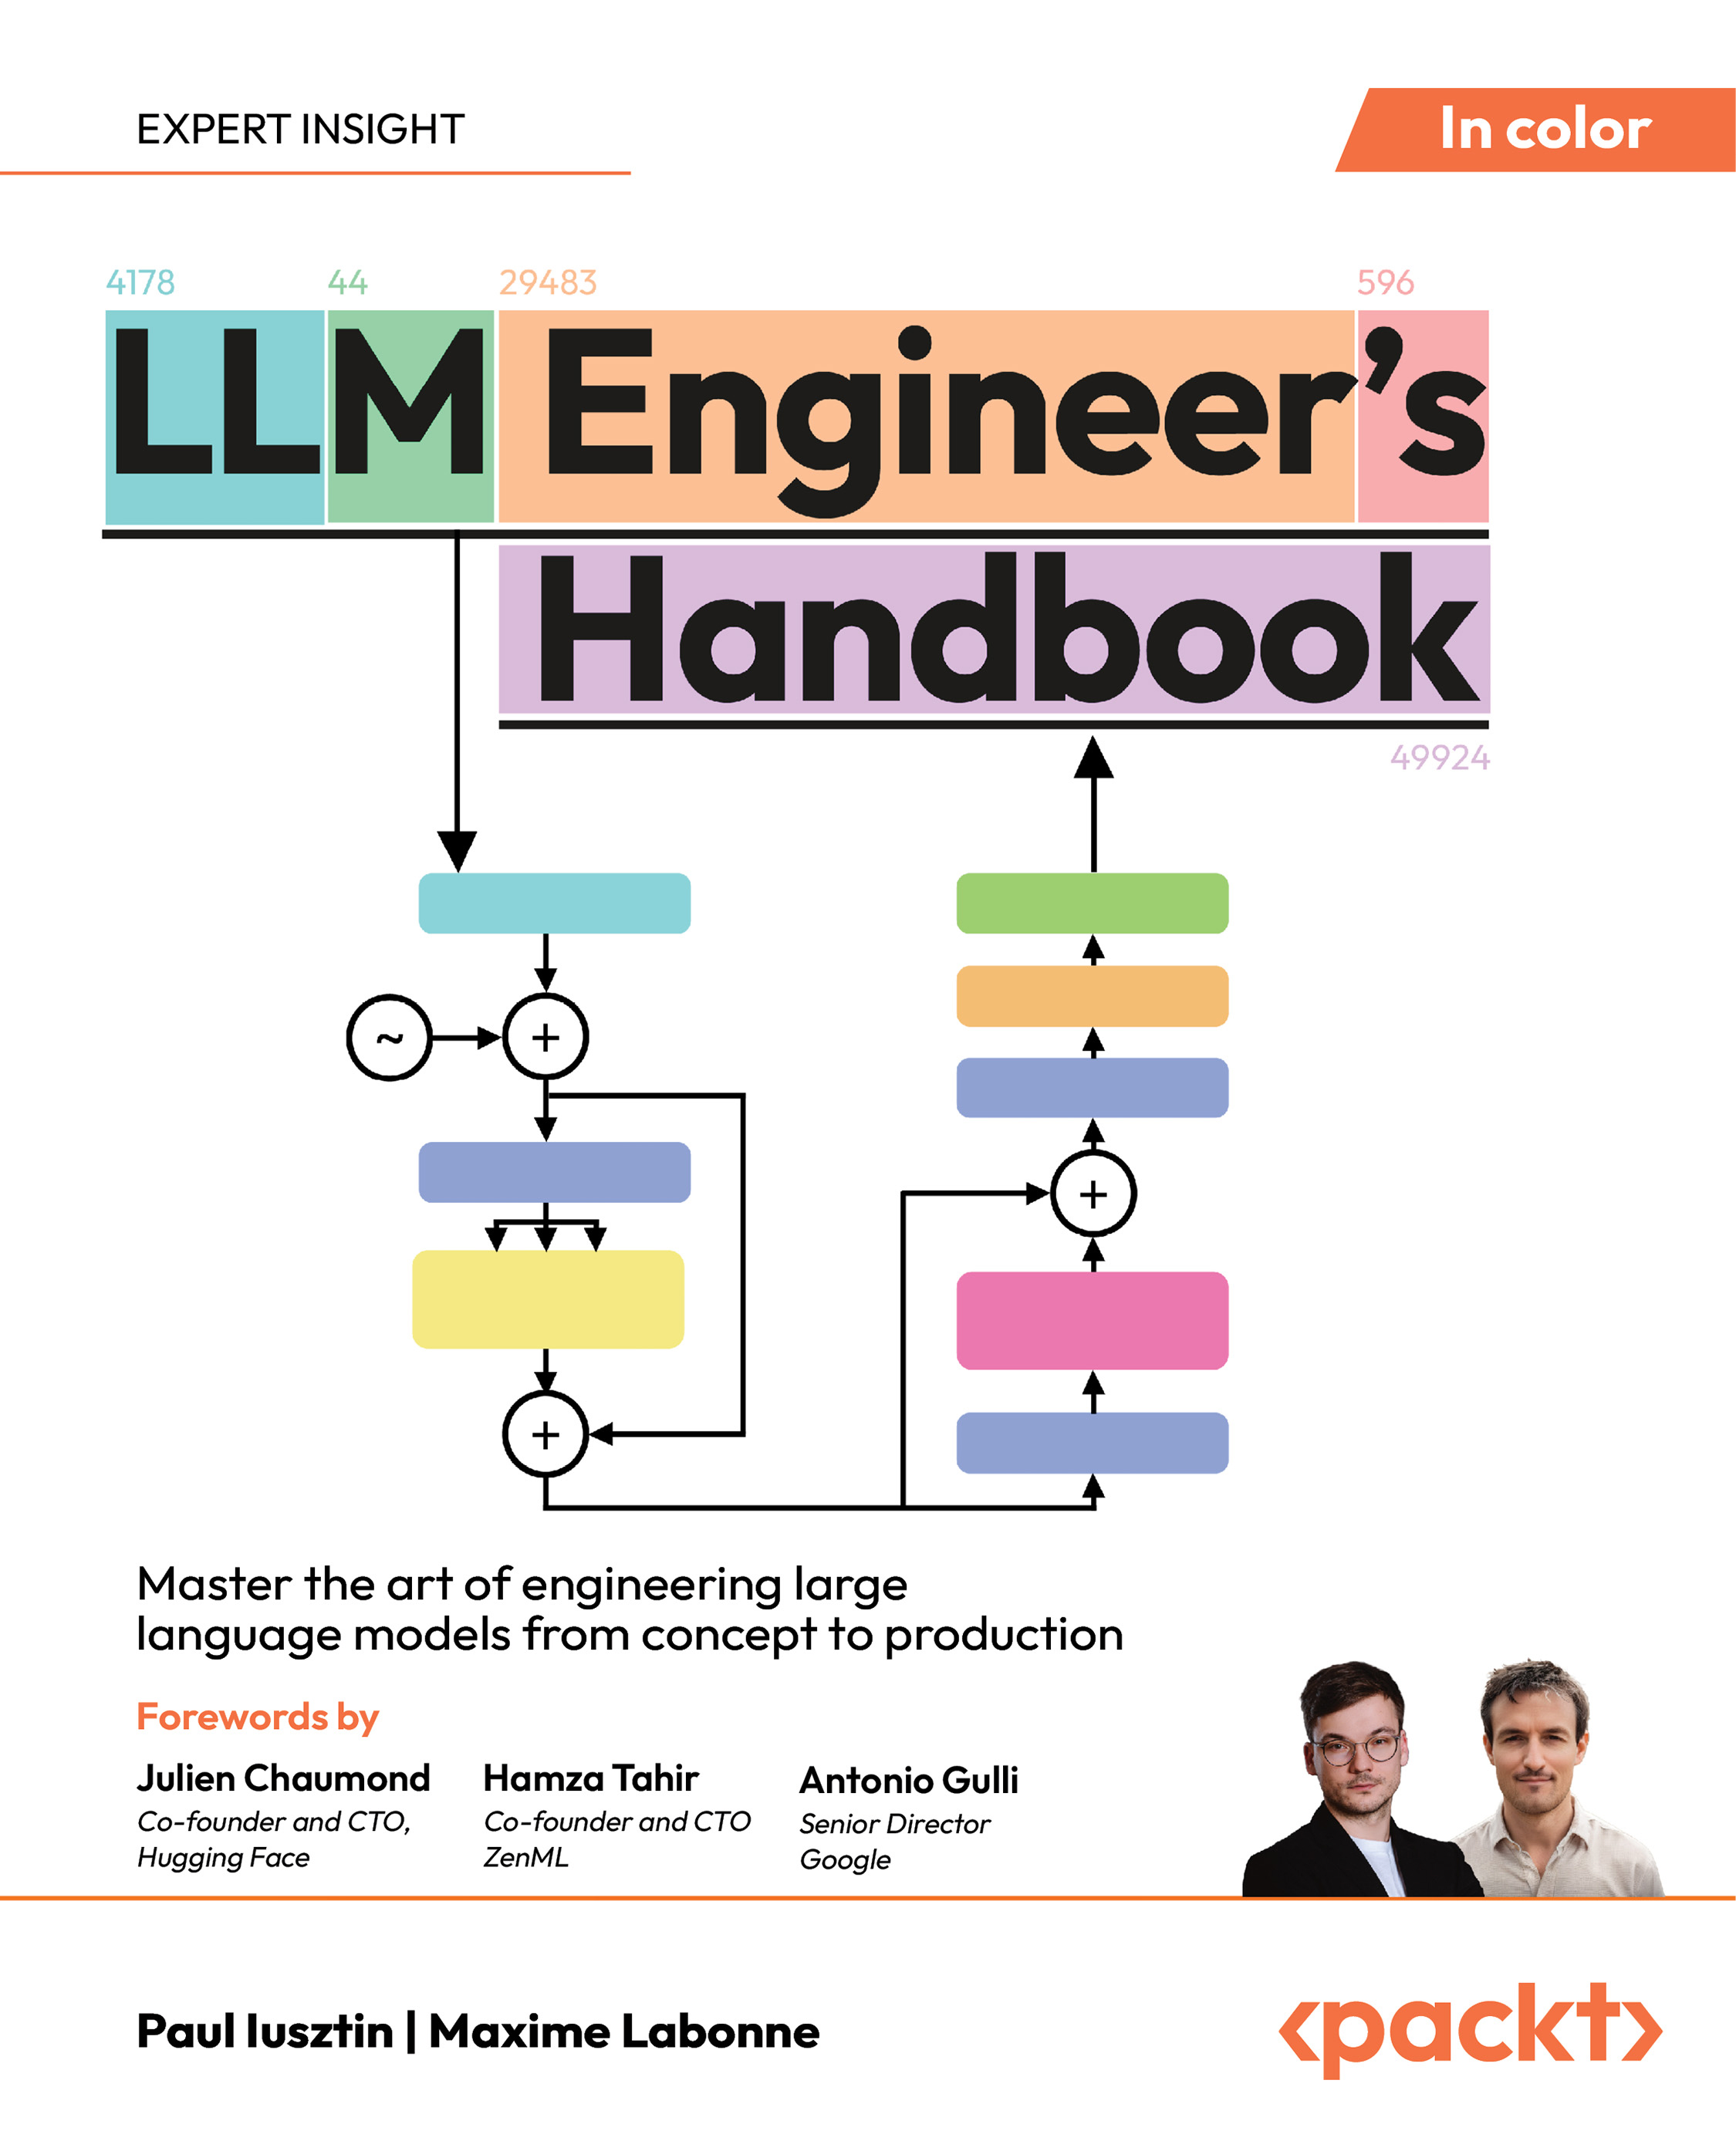
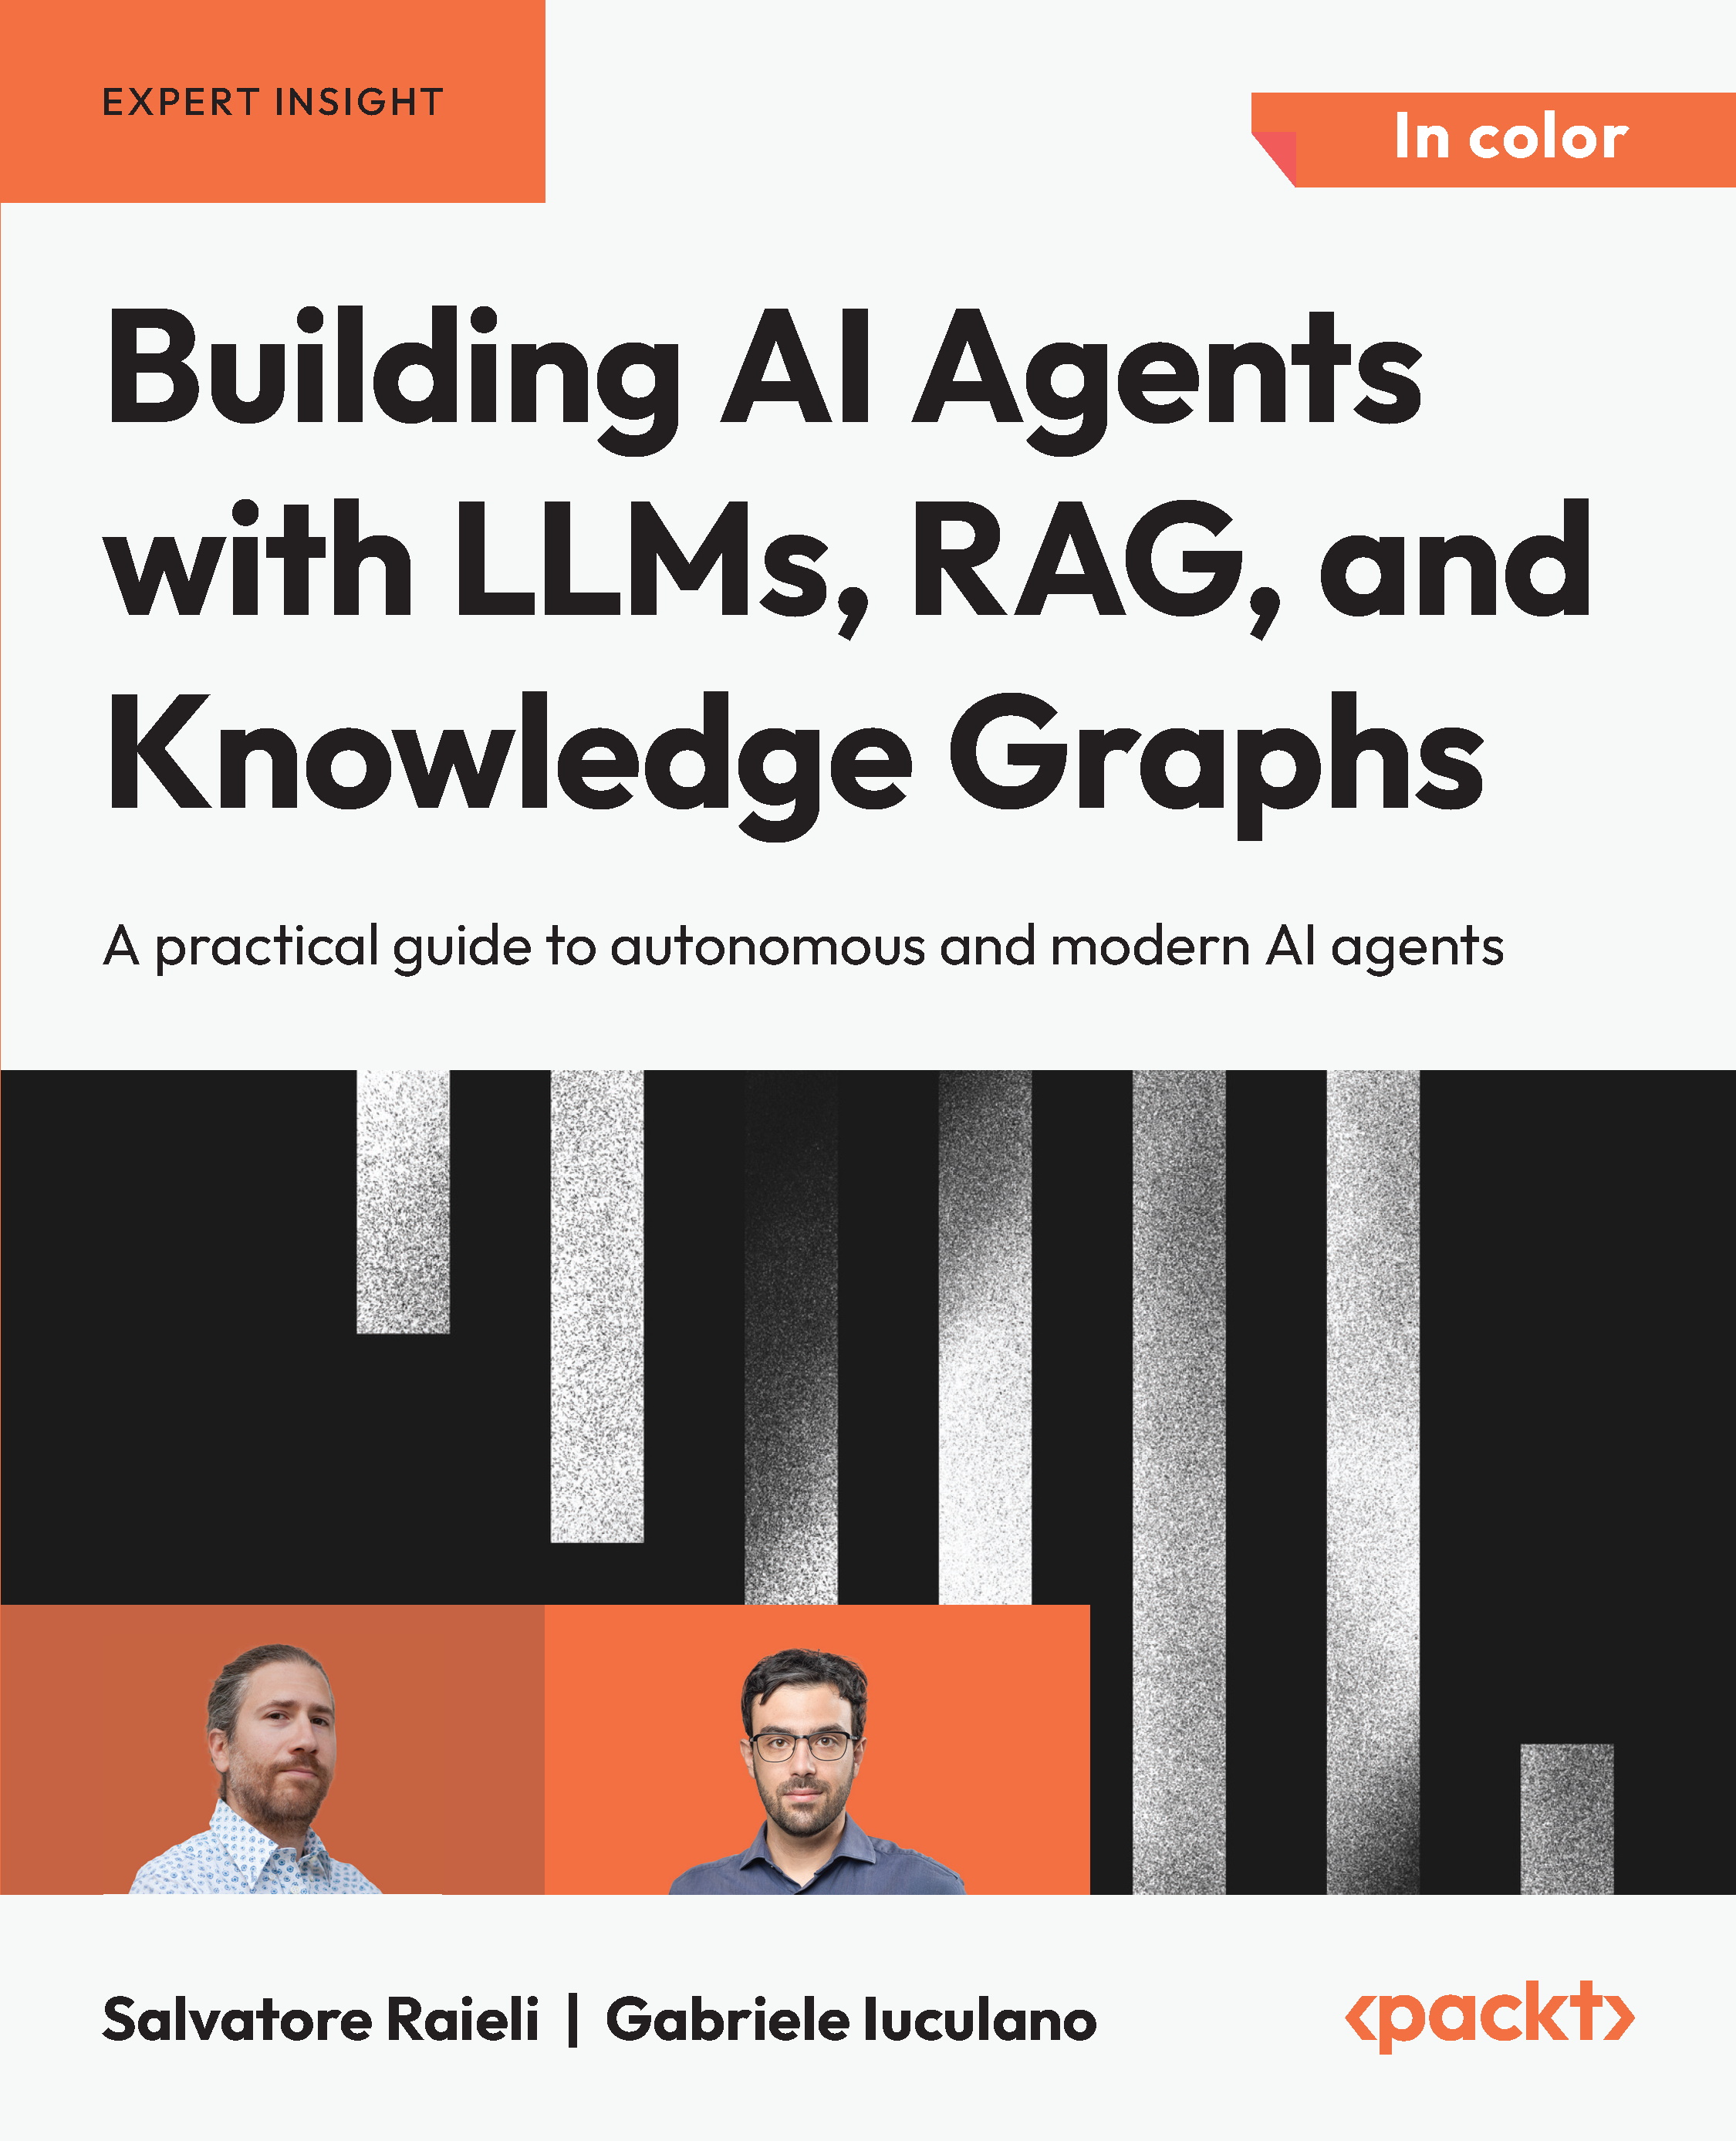
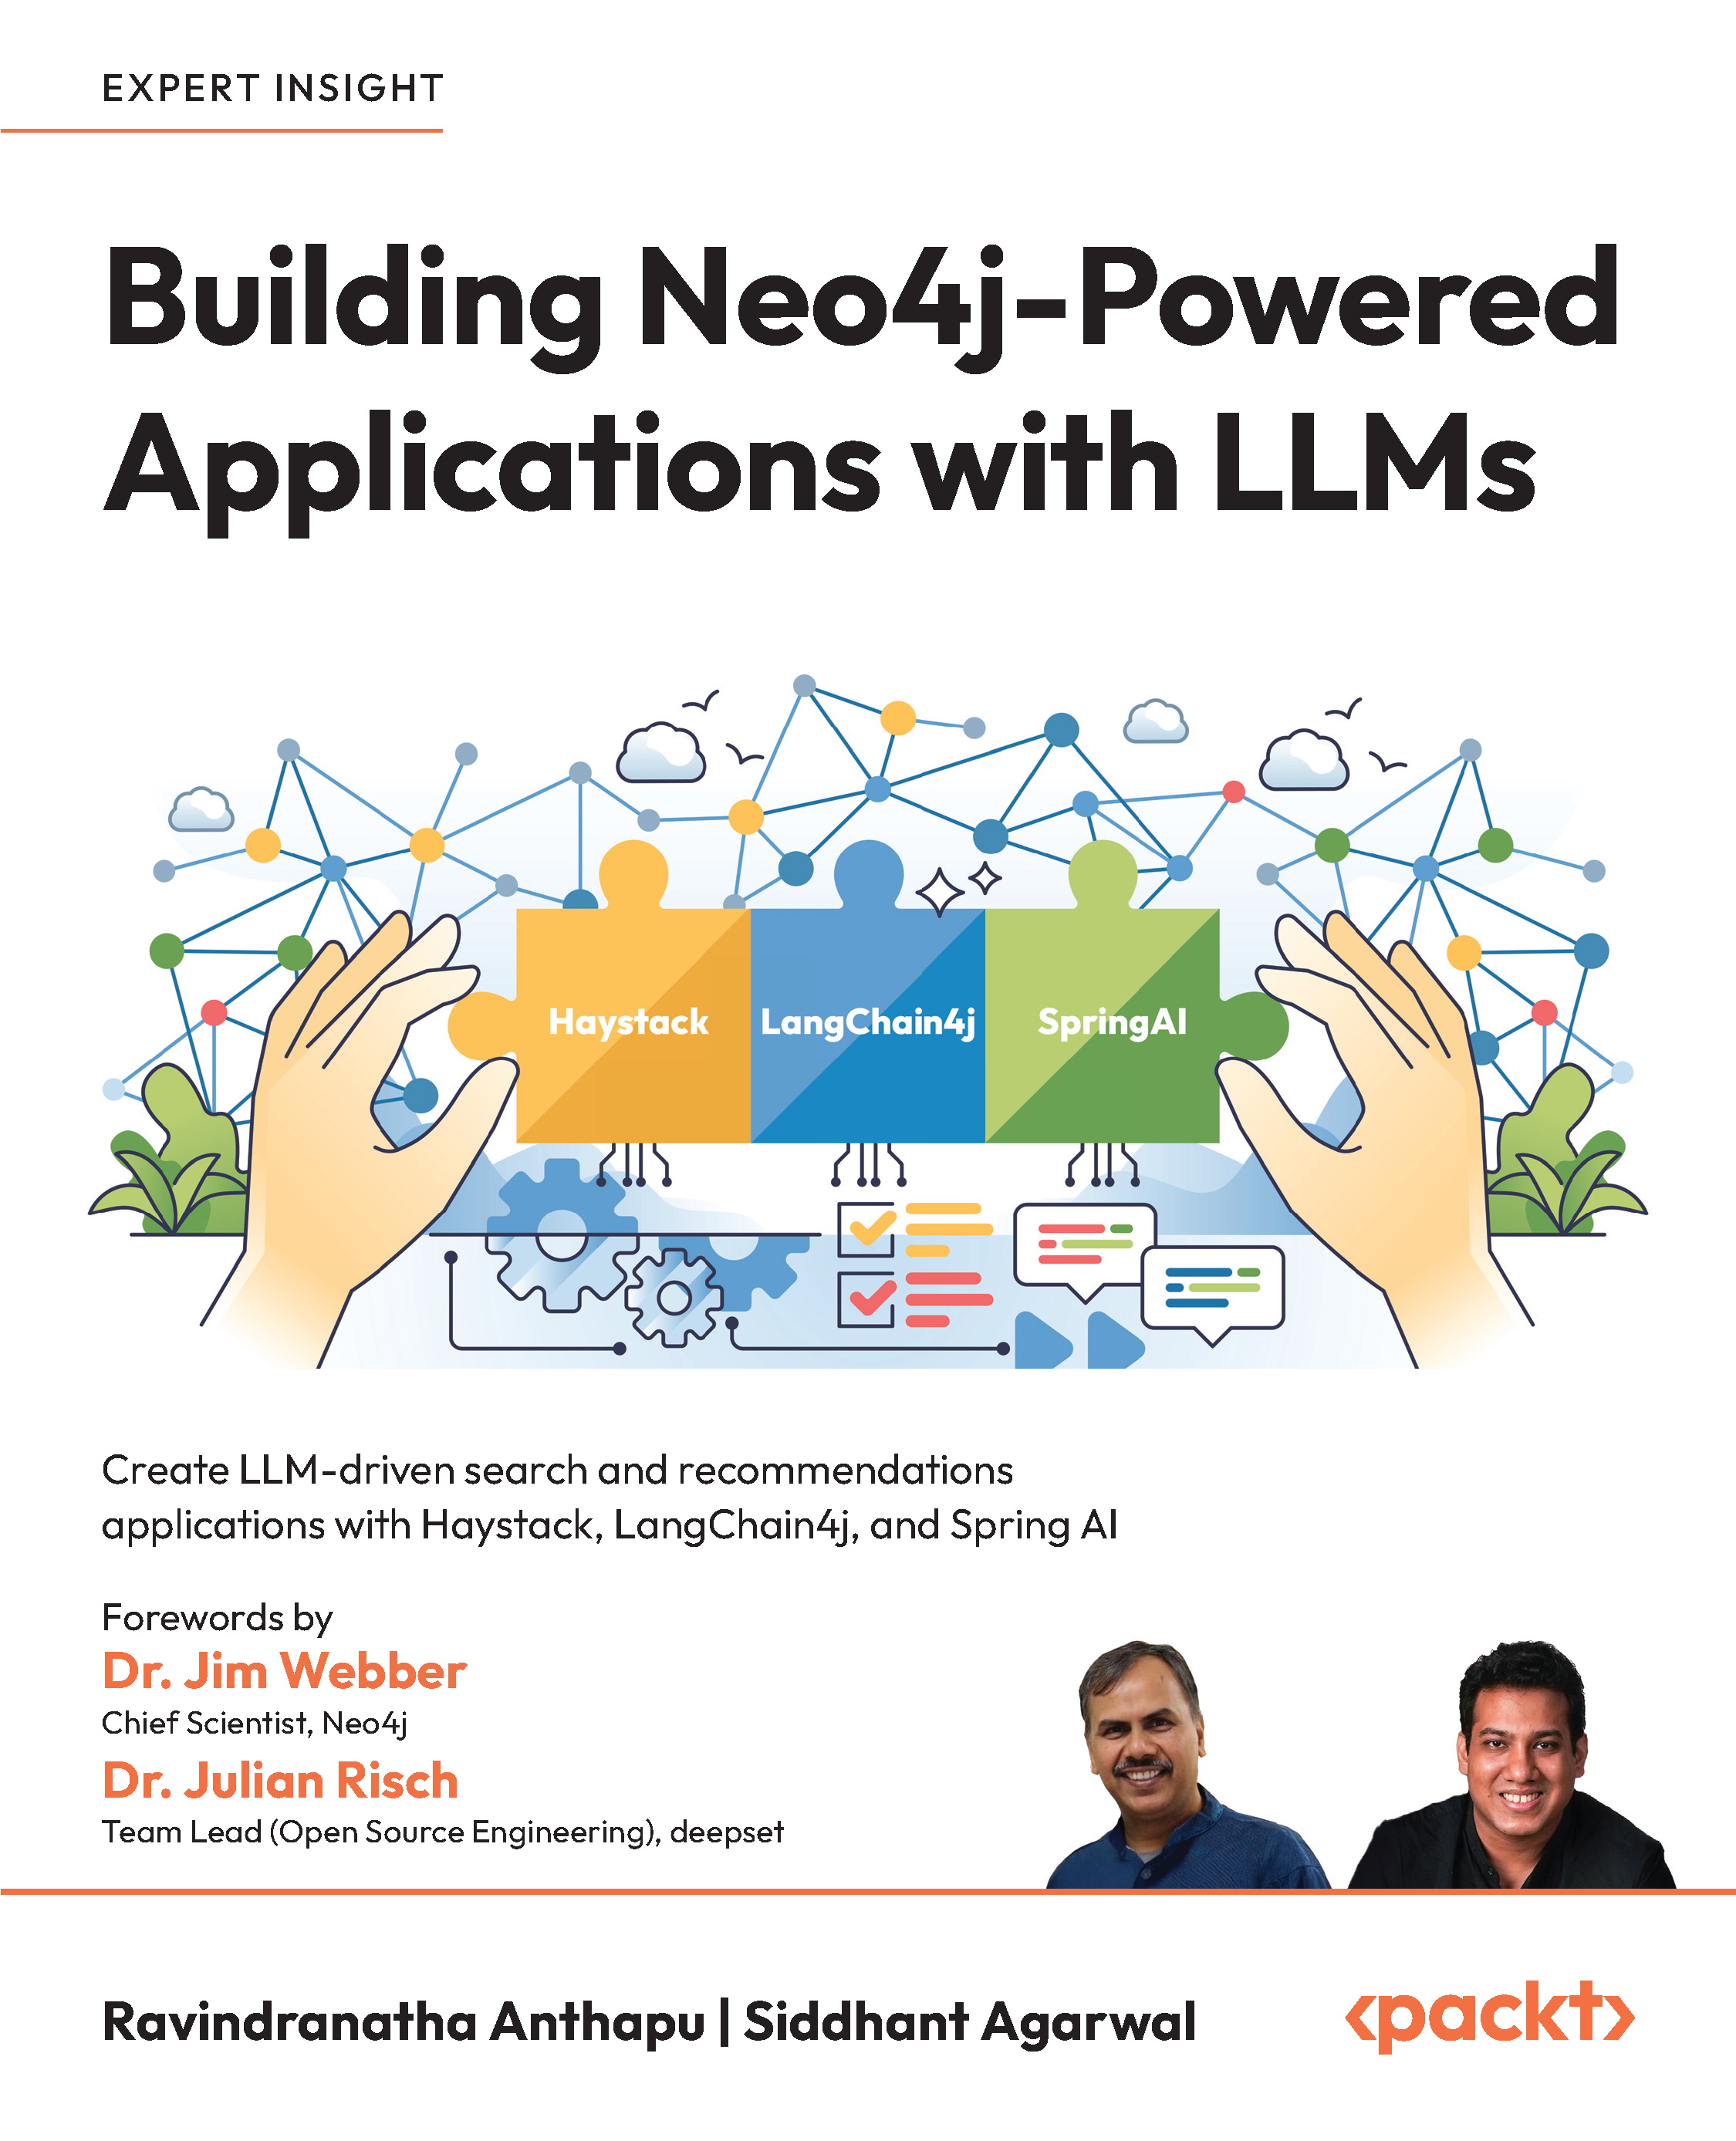
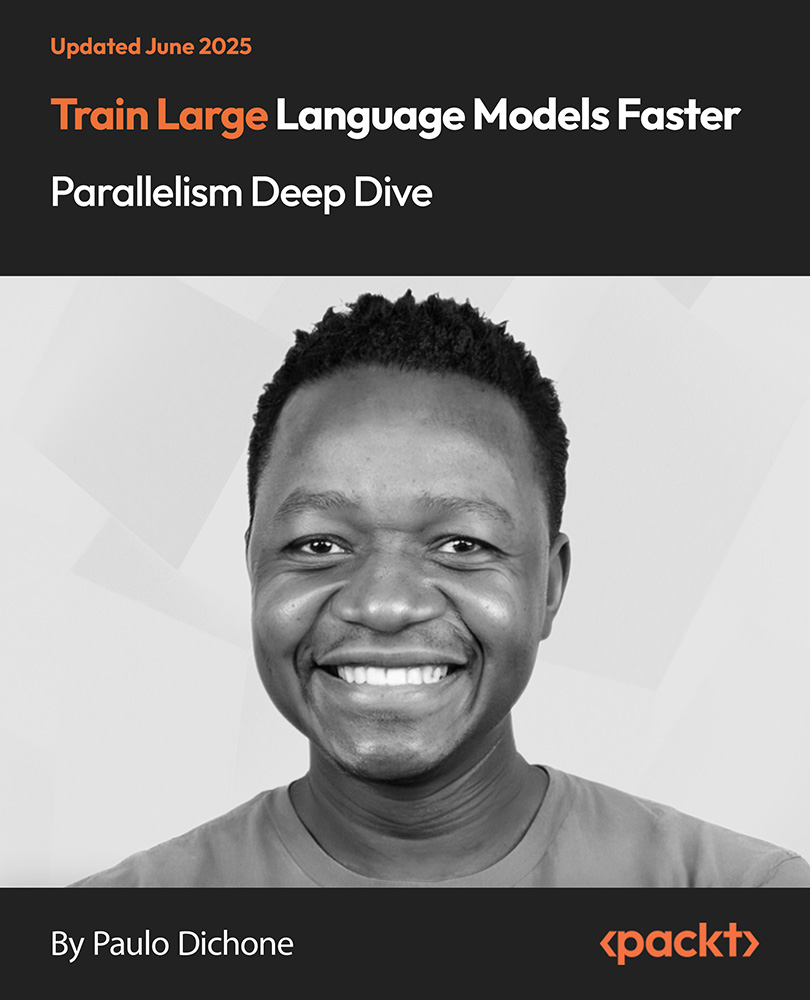
Here are some of the best:
Machine learning and artificial intelligence
Although Machine learning and artificial intelligence are huge trends in their own right, they are nevertheless closely aligned with data science. Indeed, you might even say that their prominence today has grown out of the excitement around data science that we first we witnessed just under a decade ago.
It’s a data scientist’s job to use machine learning and artificial intelligence in a way that can drive business value. That could, for example, be to recommend products or services to customers, perhaps to gain a better understanding into existing products, or even to better manage strategic and financial risks through predictive modelling.
So, while we can see machine learning in a massive range of digital products and platforms - all of which require smart development and design - for it to work successfully, it needs to be supported by a capable and creative data scientist.
Machine learning and artificial intelligence books for data scientists
Unlock access to the largest independent learning library in Tech for FREE!
Get unlimited access to 7500+ expert-authored eBooks and video courses covering every tech area you can think of.
Renews at $19.99/month. Cancel anytime
Data visualization
A talented data scientist isn’t just a great statistician and engineer, they’re also a great communicator. This means so-called soft skills are highly valuable - the ability to communicate insights and ideas with key stakeholders is essential.
But great communication isn’t just about soft skills, it’s also about data visualization. Data visualization is, at a fundamental level, about organizing and presenting data in a way that tells a story, clarifies a problem, or illustrates a solution.
It’s essential that you don’t overlook this step. Indeed, spending time learning about effective data visualization can also help you to develop your soft skills. The principles behind storytelling and communication through visualization are, in truth, exactly the same when applied to other scenarios.
Data visualization tools
There are a huge range of data visualization tools available. As with machine learning, understanding the differences between them and working out what solution will work for you is actually an important part of the learning process. For that reason, don’t be afraid to spend a little bit of time with a range of data visualization tools.
Many of the most popular data visualization tools are paid for products. Perhaps the best known of these is Tableau (which, incidentally was bought by Salesforce earlier this year). Tableau and its competitors are very user friendly, which means the barrier to entry is pretty low. They allow you to create some pretty sophisticated data visualizations fairly easily.
However, sticking to these tools is not only expensive, it can also limit your abilities. We’d recommend trying a number of different data visualization tools, such as Seabor, D3.js, Matplotlib, and ggplot2.
Data visualization books and videos for data scientists
If you want to learn data science, just get started!
As we've seen, data science requires a number of very different skills and takes in a huge breadth of tools. That means that if you're going to be a data scientist, you need to be prepared to commit to learning forver: you're never going to reach a point where you know everything.
While that might sound intimidating, it's important to have confidence. With a sense of direction and purpose, and a learning structure that works for you, it's possible to develop and build your data science capabilities in a way that could unlock new opportunities and act as the basis for some really exciting projects.
 United States
 Great Britain
 India
India
 Germany
 France
 Canada
 Russia
 Spain
Spain
 Brazil
 Australia
 Singapore
 Canary Islands
 Hungary
 Ukraine
 Luxembourg
 Estonia
 Lithuania
 South Korea
 Turkey
 Switzerland
 Colombia
 Taiwan
 Chile
Chile
 Norway
 Ecuador
 Indonesia
 New Zealand
 Cyprus
 Denmark
 Finland
 Poland
 Malta
Malta
 Czechia
 Austria
 Sweden
 Italy
Italy
 Egypt
Egypt
 Belgium
 Portugal
 Slovenia
 Ireland
 Romania
 Greece
 Argentina
 Netherlands
 Bulgaria
 Latvia
 South Africa
 Malaysia
 Japan
Japan
 Slovakia
 Philippines
 Mexico
 Thailand


