Bug status
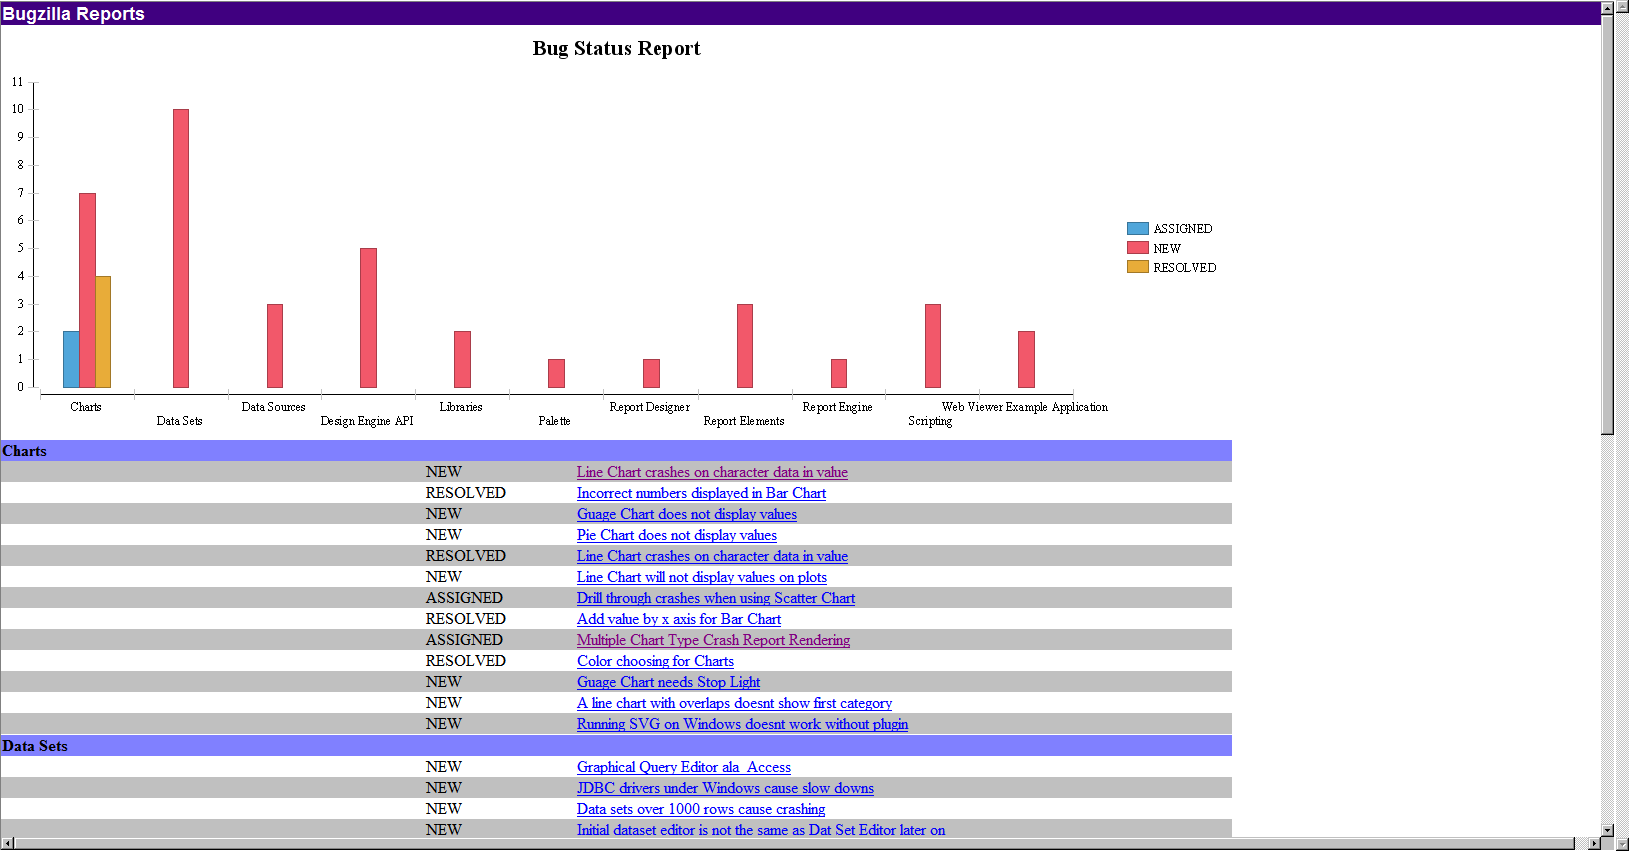
The next report we are going to undertake is the report to show open issues compared to all bugs. What we are trying to build here is a graph that shows, by category, the bugs that are open in relation to the total number of bugs for that category. No other grouping is required. Under the graph, we also want to show a list of open bugs that we can click on and have them drill down to the detail for that bug so that we can see the history of changes to that bug.
What this means is we need a bar graph showing all the status.
- Open BugzillaReportsTemplate.rptTemplate and save as bugStatusReport.rptDesign.
- Drag getAllBugs over to the Report Designer.
- Delete all columns except the bug_status field and short_desc field.
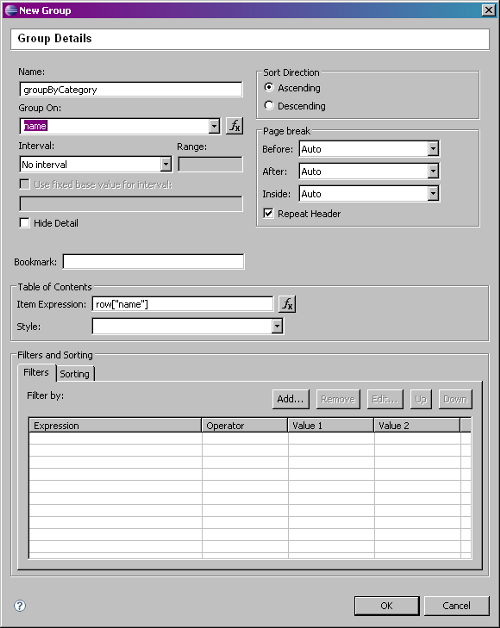
- In the table, group data by the components' name.
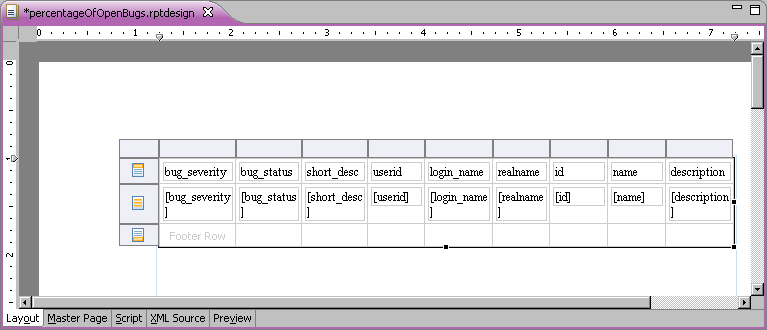
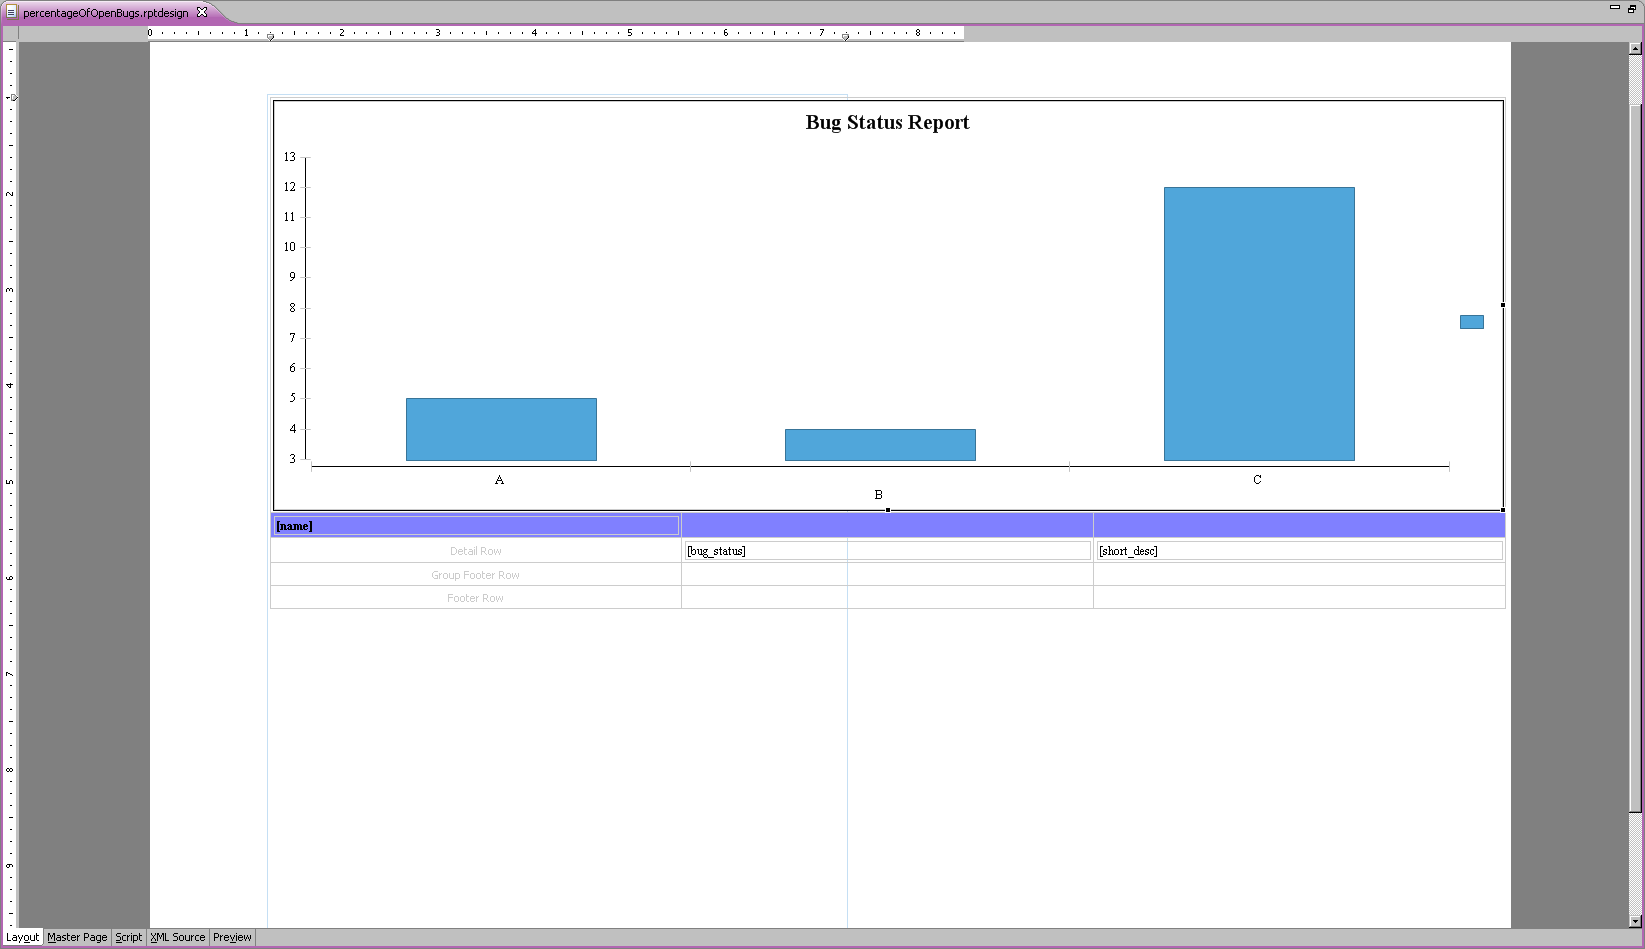
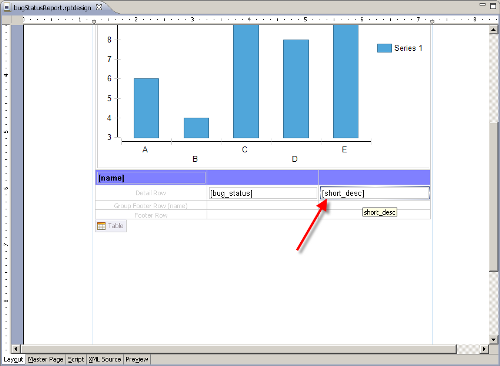
- With the new category created in the Table, insert a new column on the right. Delete the header labels. Move the data fields to look like the following screenshot:
- In the Outline tab, select the root element. Apply bugZillaTheme.
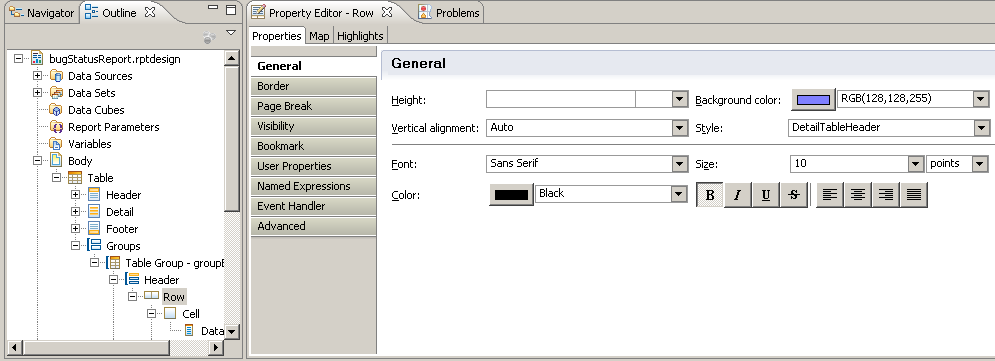
- In the group header row with the name, apply the DetailTableHeader style.
- In the Detail row, apply the DetailTableRow style.
- In the header row, select all the cells and merge them.
- In to the new merged cell, insert a chart.
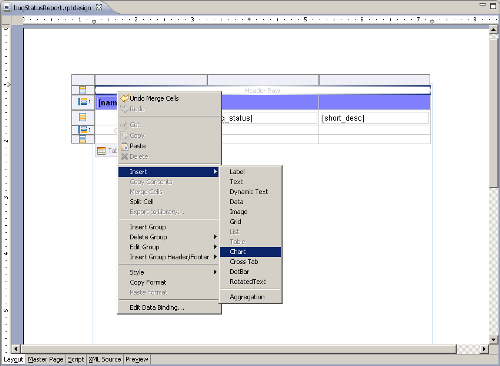
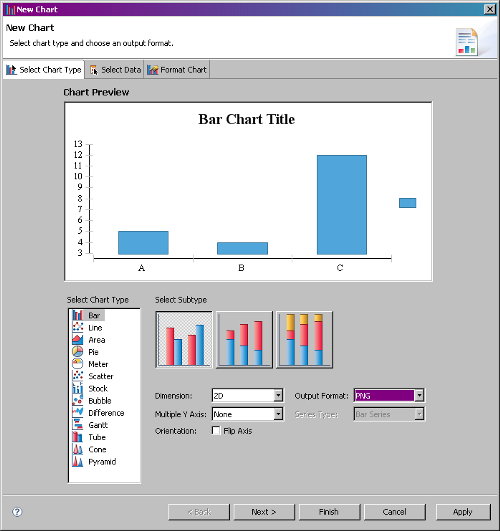
- Select a Bar Chart and change the Output Format to PNG.
- Open the Select Data tab.
- Set the Inherit Data from Container drop-down list to Inherit Columns Only.
- Drag the bug_status field to the Optional Y Series Grouping slot.
- Drag the name field to the Category (X) Series slot.
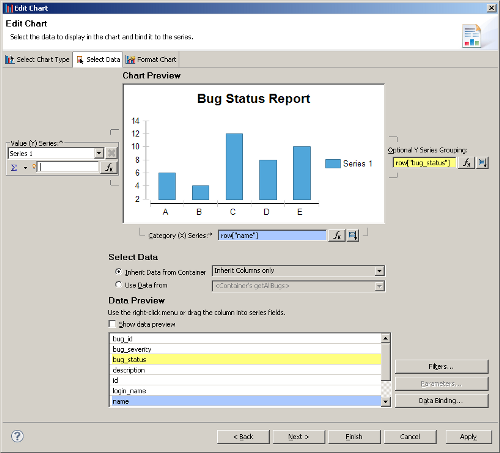
- Click on the Edit group and sorting button.
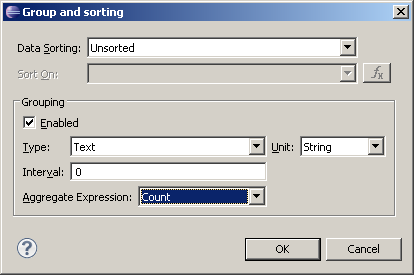
- In the Group and sorting dialog, check the Enabled checkbox.
- Set the Type to Text.
- Set the Interval to 0.
- Set the Aggregate Expression to Count.
Unlock access to the largest independent learning library in Tech for FREE!
Get unlimited access to 7500+ expert-authored eBooks and video courses covering every tech area you can think of.
Renews at $19.99/month. Cancel anytime
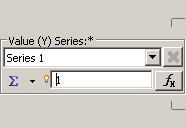
- As the Value (Y) Series, enter 1.
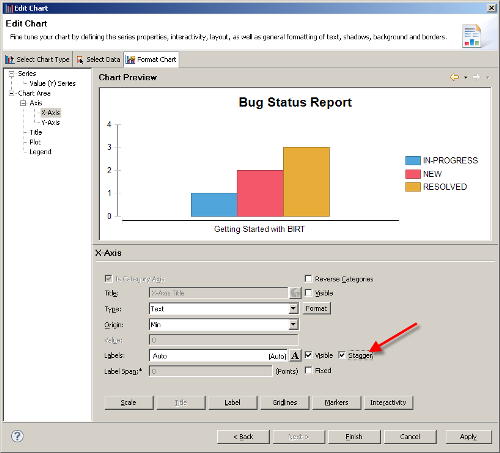
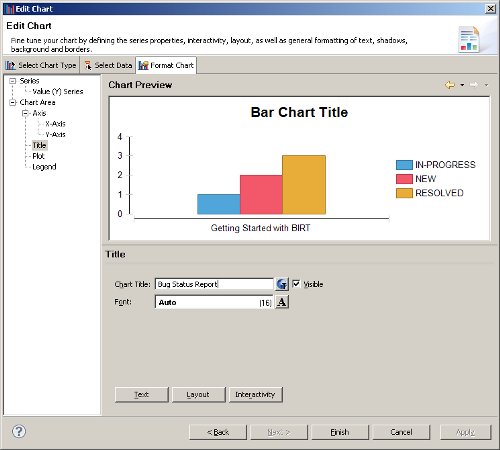
- Under the Format Chart tab, go to Title. Enter the title as Bug Status Report.
- Select the Axis option.
- Under X-Axis, check the Stagger checkbox.
- Click Finish.
- Resize the chart to fit the number of categories.
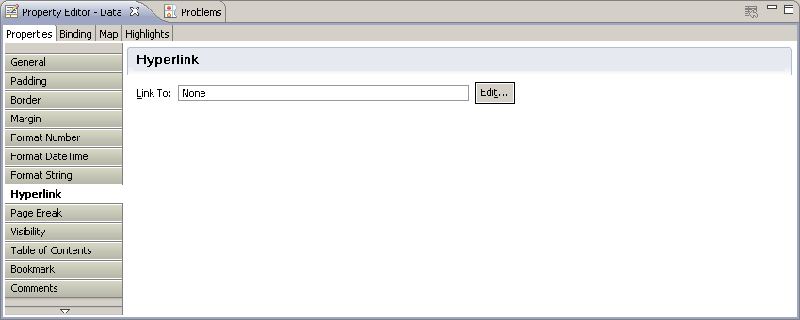
- The last thing we need to do is add the drill-through from the descriptions to the bug detail. Select the short_desc data item in the report designer.
- Under the Property Editor, select the Hyperlink tab.
- Click on the Edit... button next to Link To.
- From the Hyperlink dialog, select the Drill-through as Hyperlink type.
- Select BugzillaDetailReport.rptDesign as the target report.
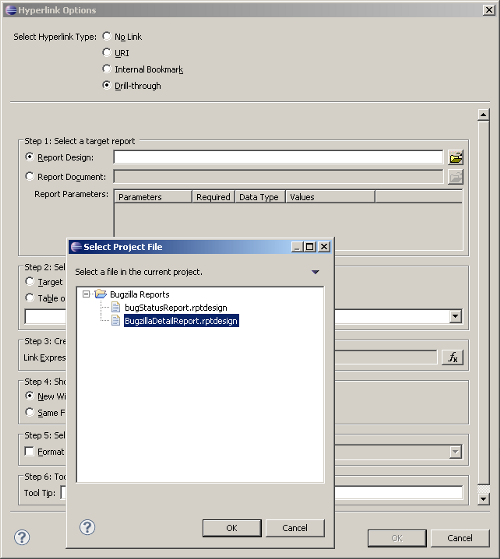
- Set up the target report parameter bugID to be linked to row["bug_id"].

- Click OK and save the report
.
 United States
 Great Britain
 India
India
 Germany
 France
 Canada
 Russia
 Spain
Spain
 Brazil
 Australia
 Singapore
 Canary Islands
 Hungary
 Ukraine
 Luxembourg
 Estonia
 Lithuania
 South Korea
 Turkey
 Switzerland
 Colombia
 Taiwan
 Chile
Chile
 Norway
 Ecuador
 Indonesia
 New Zealand
 Cyprus
 Denmark
 Finland
 Poland
 Malta
Malta
 Czechia
 Austria
 Sweden
 Italy
Italy
 Egypt
Egypt
 Belgium
 Portugal
 Slovenia
 Ireland
 Romania
 Greece
 Argentina
 Netherlands
 Bulgaria
 Latvia
 South Africa
 Malaysia
 Japan
Japan
 Slovakia
 Philippines
 Mexico
 Thailand

