


“The data model is what feeds and what powers Power BI.”
– Kasper de Jonge, Senior Program Manager, Microsoft
Data models developed in Power BI Desktop are at the center of Power BI projects, as they expose the interface in support of data exploration and drive the analytical queries visualized in reports and dashboards. Well-designed data models leverage the data connectivity and transformation capabilities to provide an integrated view of distinct business processes and entities. Additionally, data models contain predefined calculations, hierarchies groupings, and metadata to greatly enhance both the analytical power of the dataset and its ease of use. The combination of, Building a Power BI data model, querying and modeling, serves as the foundation for the BI and analytical capabilities of Power BI.
In this article, we explore how to design and develop robust data models. Common challenges in dimensional modeling are mapped to corresponding features and approaches in Power BI Desktop, including multiple grains and many-to-many relationships. Examples are also provided to embed business logic and definitions, develop analytical calculations with the DAX language, and configure metadata settings to increase the value and sustainability of models.
[box type=”note” align=”” class=”” width=””]Our article is an excerpt from the book Microsoft Power BI Cookbook, written by Brett Powell. This book contains powerful tutorials and techniques to help you with Data Analytics and visualization with Microsoft Power BI.[/box]
Designing a multi fact data model
Power BI Desktop lends itself to rapid, agile development in which significant value can be obtained quickly despite both imperfect data sources and an incomplete understanding of business requirements and use cases. However, rushing through the design phase can undermine the sustainability of the solution as future needs cannot be met without structural revisions to the model or complex workarounds. A balanced design phase in which fundamental decisions such as DirectQuery versus in-memory are analyzed while a limited prototype model is used to generate visualizations and business feedback can address both short- and long-term needs. This recipe describes a process for designing a multiple fact table data model and identifies some of the primary questions and factors to consider.
Setting business expectations
Everyone has seen impressive Power BI demonstrations and many business analysts have effectively used Power BI Desktop independently. These experiences may create an impression that integration, rich analytics, and collaboration can be delivered across many distinct systems and stakeholders very quickly or easily.
It’s important to reign in any unrealistic expectations and confirm feasibility. For example, Power BI Desktop is not an enterprise BI tool like SSIS or SSAS in terms of scalability, version control, features, and configurations. Power BI datasets cannot be incrementally refreshed like partitions in SSAS, and the current 1 GB file limit (after compression) places a hard limit on the amount of data a single model can store. Additionally, if multiple data sources are needed within the model, then DirectQuery models are not an option. Finally, it’s critical to distinguish the data model as a platform supporting robust analysis of business processes, not an individual report or dashboard itself.
Identify the top pain points and unanswered business questions in the current state. Contrast this input with an assessment of feasibility and complexity (for example, data quality and analytical needs) and Target realistic and sustainable deliverables.
How to do it
Dimensional modeling best practices and star schema designs are directly applicable to Power BI data models. Short, collaborative modeling sessions can be scheduled with subject matter experts and main stakeholders. With the design of the model in place, an informed decision of the model’s data mode (Import or DirectQuery) can be made prior to Development.
Four-step dimensional design process
- Choose the business process
- The number and nature of processes to include depends on the scale of the sources and scope of the project
- In this example, the chosen processes are Internet Sales, Reseller Sales and General Ledger
- Declare the granularity
- For each business process (or fact) to be modeled from step 1, define the meaning of each row:
-
- These should be clear, concise business definitions–each fact table should only contain one grain
- Consider scalability limitations with Power BI Desktop and balance the needs between detail and history (for example, greater history but lower granularity)
- Example: One Row per Sales Order Line, One Row per GL Account Balance per fiscal period
-
Separate business processes, such as plan and sales should never be integrated into the same table. Likewise, a single fact table should not contain distinct processes such as shipping and receiving. Fact tables can be related to common dimensions but should never be related to each other in the data model (for example, PO Header and Line level).
- Identify the dimensions
- These entities should have a natural relationship with the business process or event at the given granularity
- Compare the dimension with any existing dimensions and hierarchies in the organization (for example, Store)
If so, determine if there’s a conflict or if additional columns are required
Be aware of the query performance implications with large, high cardinality dimensions such as customer tables with over 2 million rows. It may be necessary to optimize this relationship in the model or the measures and queries that use this relationship. See Chapter 11, Enhancing and Optimizing Existing Power BI Solutions, for more details.
- Identify the facts
- These should align with the business processes being modeled: For example, the sum of a quantity or a unique count of a dimension
- Document the business and technical definition of the primary facts and compare this with any existing reports or metadata repository (for example, Net Sales = Extended Amount – Discounts).
- Given steps 1-3, you should be able to walk through top business questions and check whether the planned data model will support it. Example: “What was the variance between Sales and Plan for last month in Bikes?”
Any clear gaps require modifying the earlier steps, removing the question from the scope of the data model, or a plan to address the issue with additional logic in the model (M or DAX).
Focus only on the primary facts at this stage such as the individual source columns that comprise the cost facts. If the business definition or logic for core fact has multiple steps and conditions, check if the data model will naturally simplify it or if the logic can be developed in the data retrieval to avoid complex measures.
Data warehouse and implementation bus matrix
The Power BI model should preferably align with a corporate data architecture framework of standard facts and dimensions that can be shared across models. Though consumed into
Power BI Desktop, existing data definitions and governance should be observed. Any new facts, dimensions, and measures developed with Power BI should supplement this architecture.
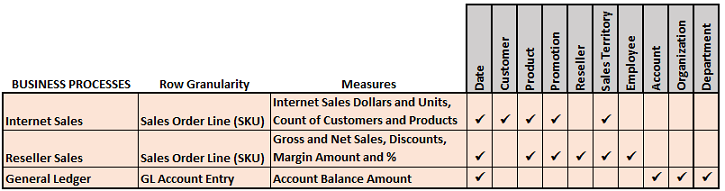
- Create a data warehouse bus matrix:
A matrix of business processes (facts) and standard dimensions is a primary tool for designing and managing data models and communicating the overall BI architecture.

In this example, the business processes selected for the model are Internet Sales, Reseller Sales, and General Ledger.
- Create an implementation bus matrix:
An outcome of the model design process should include a more detailed implementation bus matrix.
Clarity and approval of the grain of the fact tables, the definitions of the primary measures, and all dimensions gives confidence when entering the development phase.
Power BI queries (M) and analysis logic (DAX) should not be considered a long-term substitute for issues with data quality, master data management, and the data warehouse. If it is necessary to move forward, document the “technical debts” incurred and consider long-term solutions such as Master Data Services (MDS).
Choose the dataset storage mode – Import or DirectQuery
With the logical design of a model in place, one of the top design questions is whether to implement this model with DirectQuery mode or with the default imported In-Memory mode.
In-Memory mode
The default in-memory mode is highly optimized for query performance and supports additional modeling and development flexibility with DAX functions. With compression, columnar storage, parallel query plans, and other techniques an import mode model is able to support a large amount of data (for example, 50M rows) and still perform well with complex analysis expressions. Multiple data sources can be accessed and integrated in a single data model and all DAX functions are supported for measures, columns, and role security.
However, the import or refresh process must be scheduled and this is currently limited to eight refreshes per day for datasets in shared capacity (48X per day in premium capacity). As an alternative to scheduled refreshes in the Power BI service, REST APIs can be used to trigger a data refresh of a published dataset. For example, an HTTP request to a Power BI REST API calling for the refresh of a dataset can be added to the end of a nightly update or ETL process script such that published Power BI content remains aligned with the source systems. More importantly, it’s not currently possible to perform an incremental refresh such as the Current Year rows of a table (for example, a table partition) or only the source rows that have changed. In-Memory mode models must maintain a file size smaller than the current limits (1 GB compressed currently, 10GB expected for Premium capacities by October 2017) and must also manage refresh schedules in the Power BI Service. Both incremental data refresh and larger dataset sizes are identified as planned capabilities of the Microsoft Power BI Premium Whitepaper (May 2017).
DirectQuery mode
A DirectQuery mode model provides the same semantic layer interface for users and contains the same metadata that drives model behaviors as In-Memory models. The performance of DirectQuery models, however, is dependent on the source system and how
this data is presented to the model. By eliminating the import or refresh process, DirectQuery provides a means to expose reports and dashboards to source data as it changes. This also avoids the file size limit of import mode models. However, there are several limitations and restrictions to be aware of with DirectQuery:
- Only a single database from a single, supported data source can be used in a DirectQuery model.
- When deployed for widespread use, a high level of network traffic can be generated thus impacting performance.
- Power BI visualizations will need to query the source system, potentially via an on-premises data gateway.
- Some DAX functions cannot be used in calculated columns or with role security.
- Additionally, several common DAX functions are not optimized for DirectQuery performance.
- Many M query transformation functions cannot be used with DirectQuery.
- MDX client applications such as Excel are supported but less metadata (for example, hierarchies) is exposed.
Given these limitations and the importance of a “speed of thought” user experience with Power BI, DirectQuery should generally only be used on centralized and smaller projects in which visibility to updates of the source data is essential. If a supported DirectQuery system (for example, Teradata or Oracle) is available, the performance of core measures and queries should be tested.
Confirm referential integrity in the source database and use the Assume Referential Integrity relationship setting in DirectQuery mode models. This will generate more efficient inner join SQL queries against the source Database.
How it works
DAX formula and storage engine
Power BI Datasets and SQL Server Analysis Services (SSAS) share the same database engine and architecture. Both tools support both Import and DirectQuery data models and both DAX and MDX client applications such as Power BI (DAX) and Excel (MDX). The DAX
Query Engine is comprised of a formula and a storage engine for both Import and DirectQuery models. The formula engine produces query plans, requests data from the storage engine, and performs any remaining complex logic not supported by the storage engine against this data such as IF and SWITCH functions In DirectQuery models, the data source database is the storage engine–it receives SQL queries from the formula engine and returns the results to the formula engine. For In- Memory models, the imported and compressed columnar memory cache is the storage engine.
We discussed about building data models using Microsoft power BI. If you liked our post, be sure to check out Microsoft Power BI Cookbook to gain more information on using Microsoft power BI for data analysis and visualization.

Read Next:
Unlocking the secrets of Microsoft Power BI
Microsoft spring updates for PowerBI and PowerApps
How to build a live interactive visual dashboard in Power BI with Azure Stream