Home Data News Build custom maps the easy way with multiple map layers in Tableau...

Build custom maps the easy way with multiple map layers in Tableau from What’s New

0
1076
4 min read

Kristin Adderson
December 22, 2020 – 8:04pm

December 22, 2020

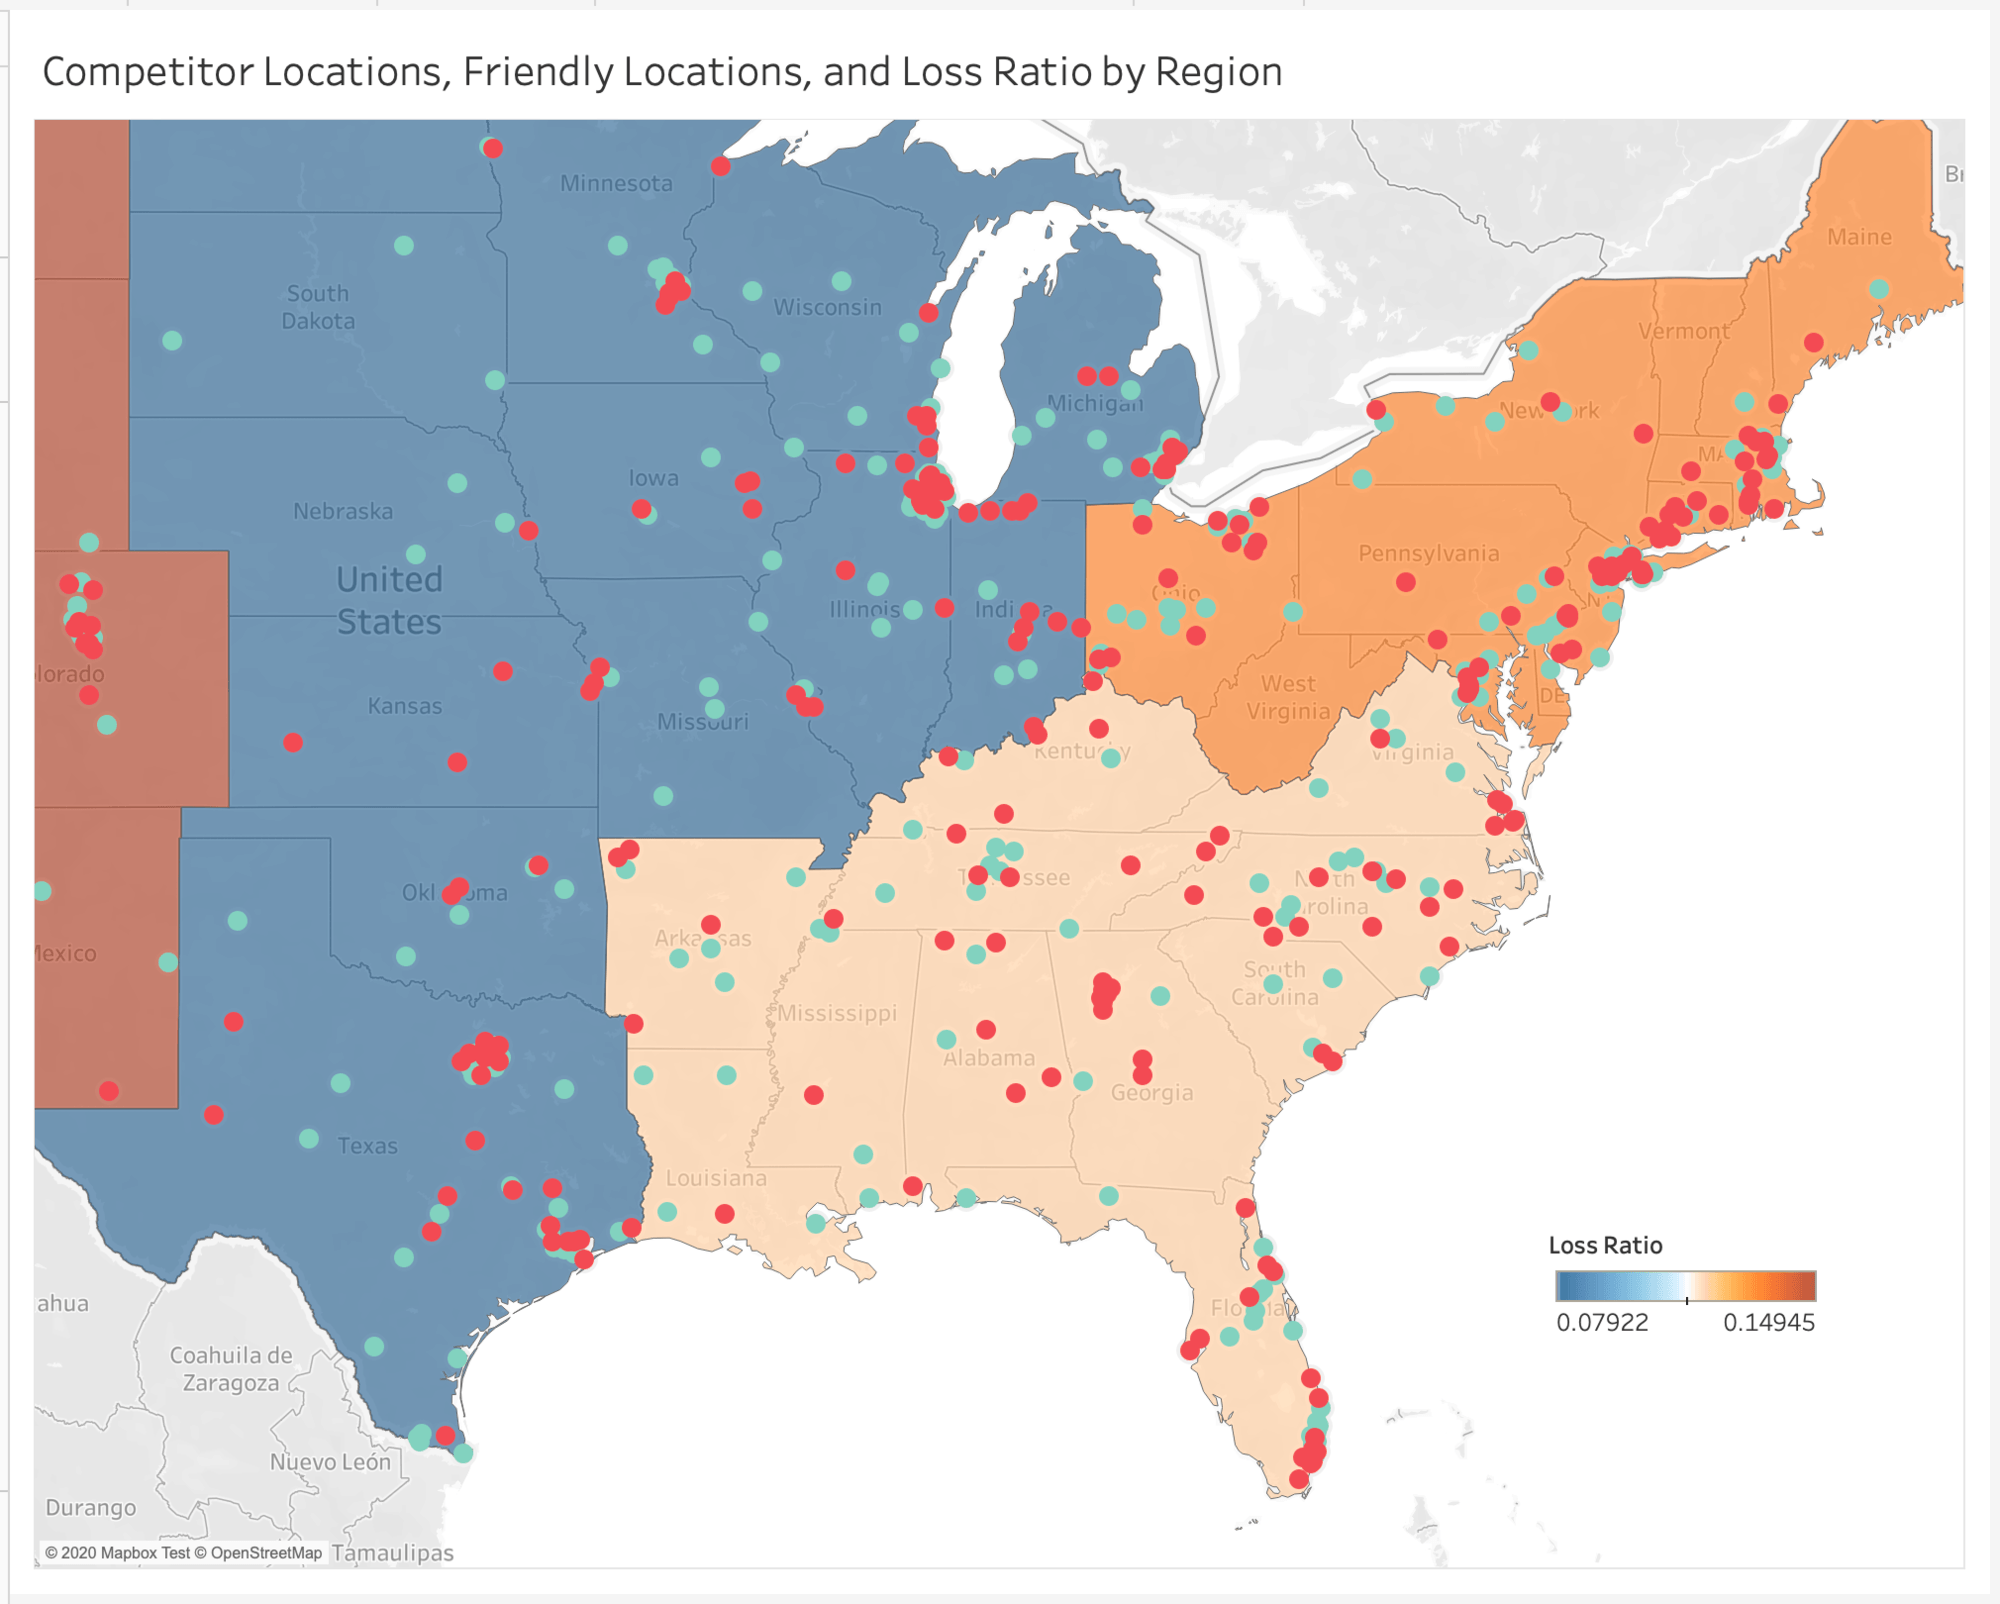
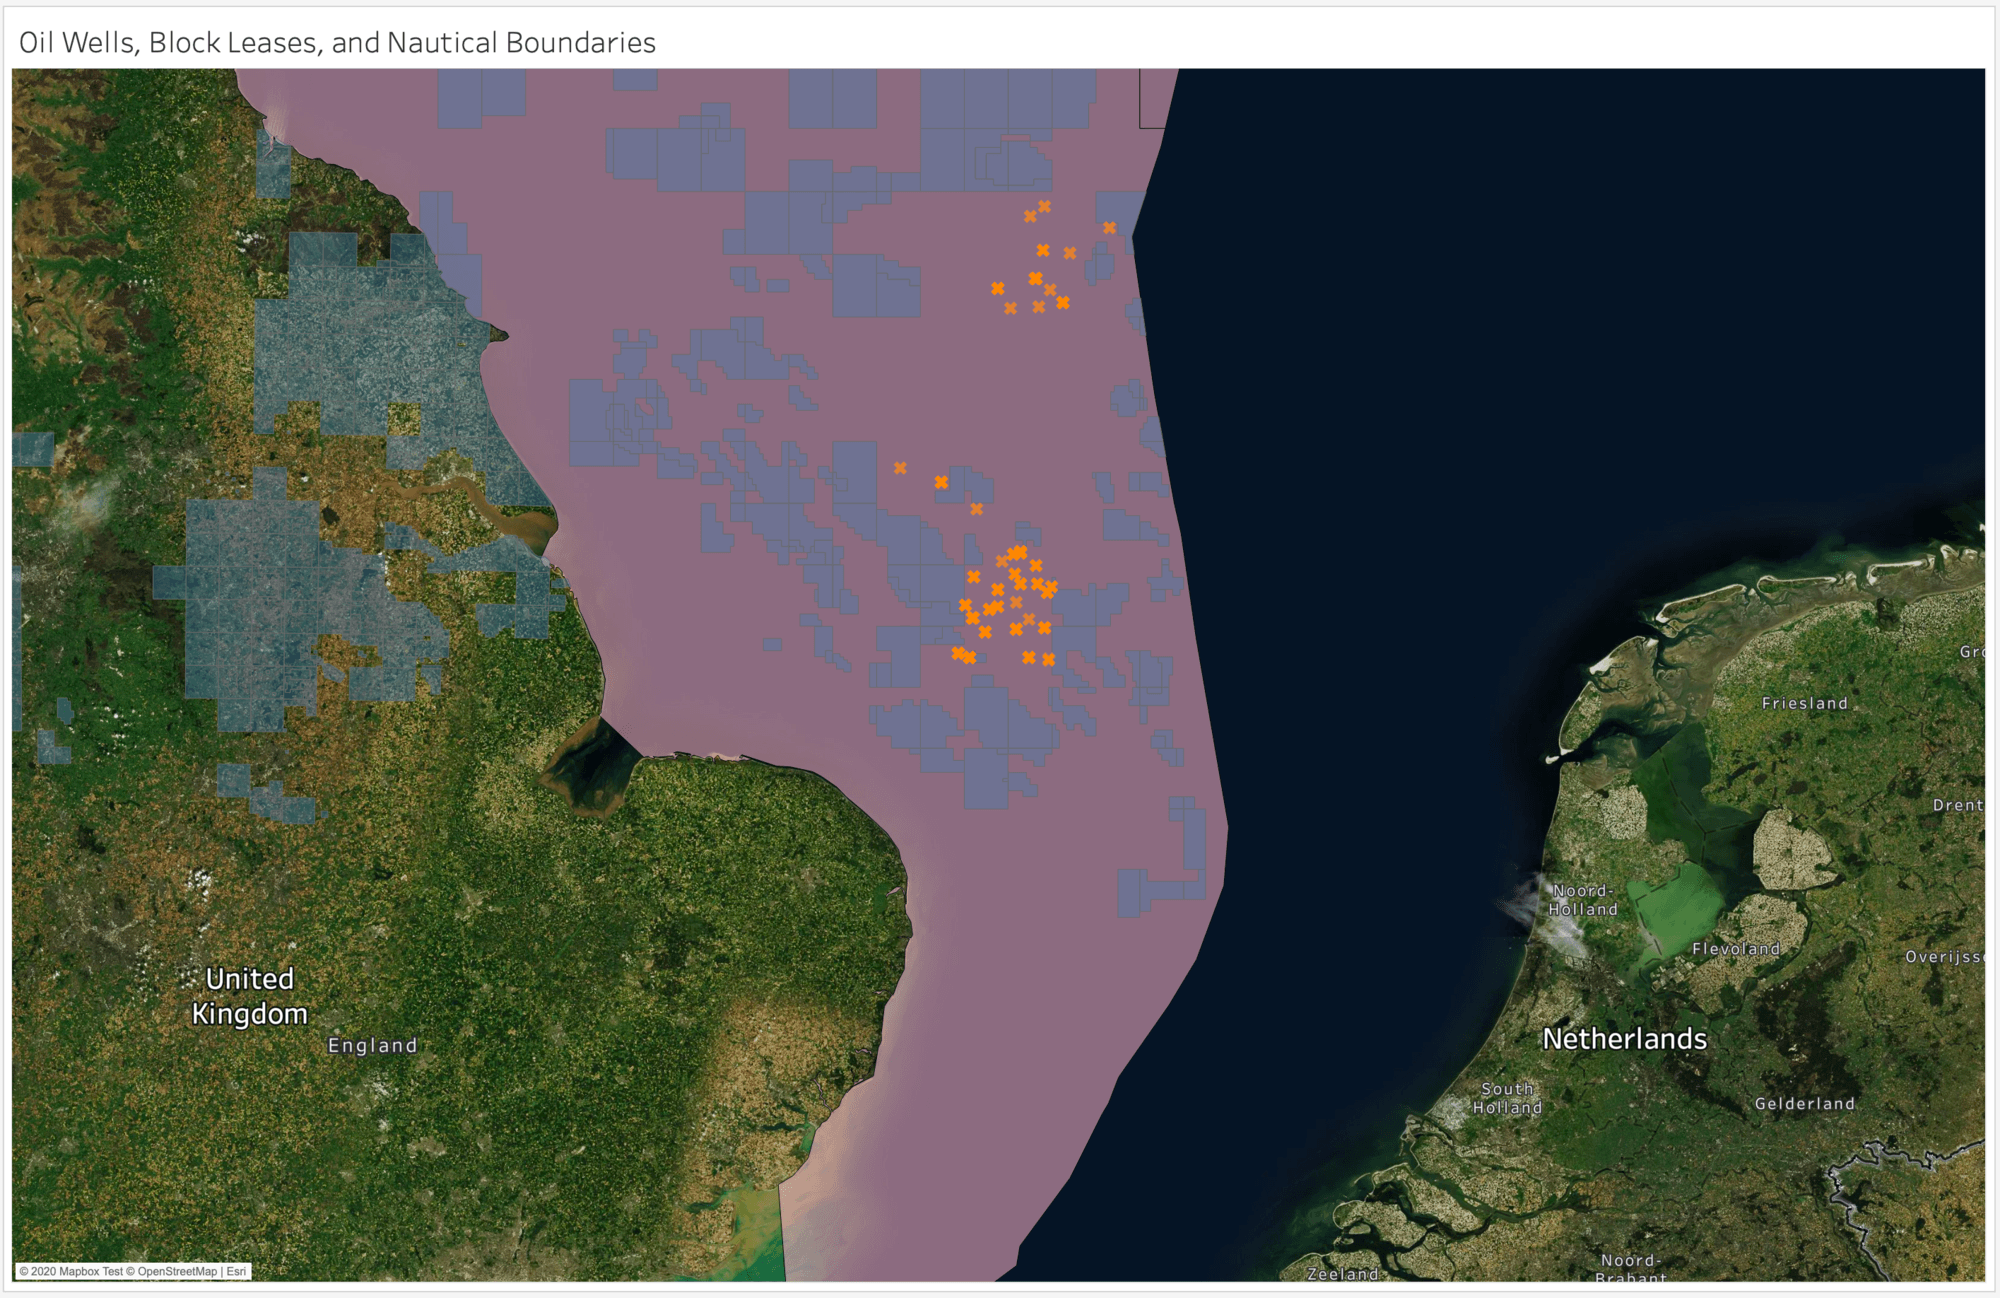
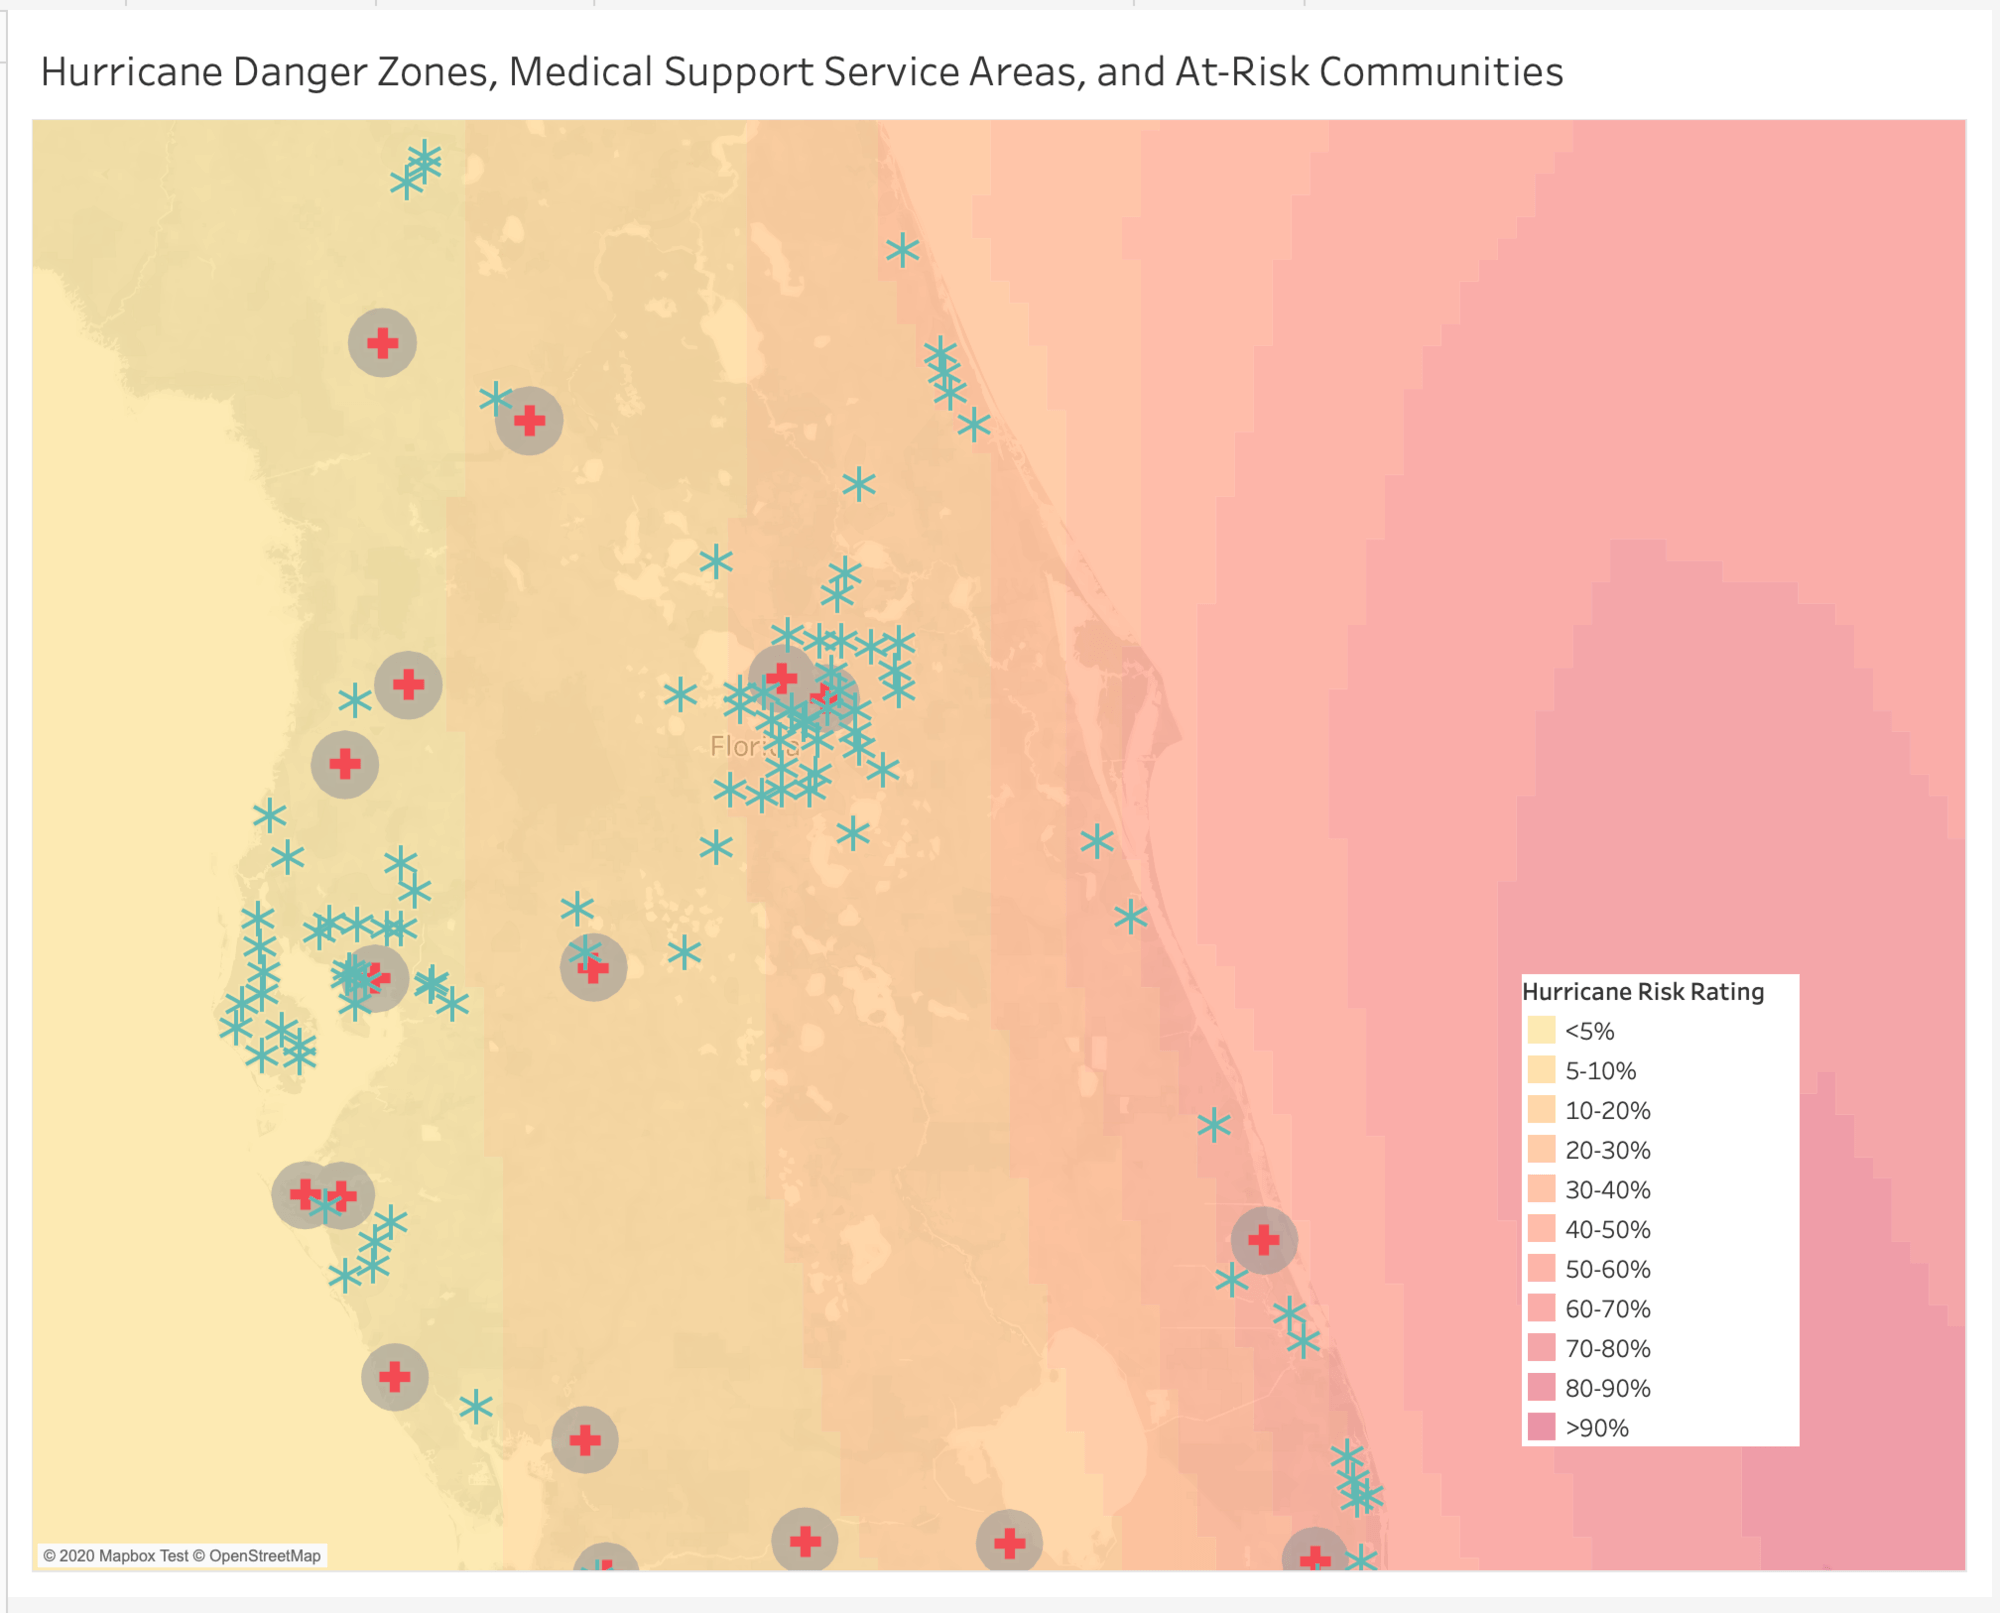
The Tableau 2020.4 release comes fully-loaded with tons of great features, including several key updates to boost your geospatial analysis. In particular, the new multiple marks layers feature lets you add an unlimited number of layers to the map. This means you can visualize multiple sets of location data in context of one another, and there’s no need for external tools to build custom background maps. 

Drag and drop map layers—yes, it’s just that easy

Learn Programming & Development with a Packt Subscription

Spend less time preparing spatial datasets and more time analyzing your data with drag-and-drop map layers across Tableau Online, Server, and Desktop in Tableau 2020.4. Getting started is easy! Once you’ve connected to a datasource that contains location data and created a map, simply drag any geographic field onto the Add a Marks Layers drop target, and Tableau will instantly draw the new layer of marks on the map.

For each layer that you create, Tableau provides a new marks card, so you can encode each layer’s data by size, shape, and color. What’s more, you can even control the formatting of each layer independently, giving you maximum flexibility in controlling the appearance of your map. 

But that’s not all. While allowing you to draw an unlimited number of customized map layers is a powerful capability in its own right, the multiple map layers feature in Tableau gives you even more tools that you can use to supercharge your analytics.

First up: the ability to toggle the visibility of each layer. With this feature, you can decide to show or hide each layer at will, allowing you to visualize only the relevant layers for the question at hand. You can use this feature by hovering over each layer’s name in the marks card, revealing the interactive eye icon.

Multiple map layers in Tableau

Sometimes, you may want only some of your layers to be interactive, and the remaining layers to simply be part of the background. And luckily, the multiple map layers feature allows you to have exactly this type of control. Hovering over each layer’s name in the marks card reveals a dropdown arrow. Clicking on this arrow, you can select the first option in the context menu: Disable Selection. With this option, you can customize the end-user experience, ensuring that background contextual layers do not produce tooltips or other interactive elements when not required. 

Build custom maps the easy way with multiple map layers in Tableau

Finally, you also have fine-grained control over the drawing order, or z-order, of layers on your map. With this capability, you can ensure that background layers that may obscure other map features are drawn on the bottom. To adjust the z-order of layers on the map, you can either drag to reorder your layers in the marks card, or you can use the Move Up and Move Down options in each layer’s dropdown context menu. 

Drawing an unlimited number of map layers is critical to helping you build authoritative, context-appropriate maps for your organization. This is helpful for a wide variety of use cases across industries and businesses. Check out some more examples below:

A national coffee chain might want to visualize stores, competitor locations, and win/loss metrics by sales area to understand competitive pressures.

Build custom maps the easy way with multiple map layers in Tableau

In the oil and gas industry, visualizing drilling rigs, block leases, and nautical boundaries could help devise exploration and investment strategies.

A disaster relief NGO may decide to map out hurricane paths, at-risk hospitals, and first-responder bases to deploy rescue teams to those in need.

Essentially, you can use this feature to build rich context into your maps and support easy analysis and exploration for any scenario!

Plus, spatial updates across the stack: Tableau Prep, Amazon Redshift, and offline maps

The 2020.4 release will also include other maps feature to help you take location intelligence to the next level. In this release, we’re including support for spatial data in Tableau Prep, so you can clean and transform your location data without having to use a third party tool. We’re also including support for spatial data from Amazon Redshift databases, and offline maps for Tableau Server, so you can use Tableau maps in any environment and connect to your location data directly from more data sources. 

Want to know what else we released with Tableau 2020.4? Learn about Tableau Prep in the browser, web authoring and predictive modeling enhancements, and more in our launch announcement.

We’d love your feedback

Can you think of additional features you need to take your mapping in Tableau to greater heights? We would love to hear from you! Submit your request on the Tableau Ideas Forum today. Every idea is considered by our Product Management team and we value your input in making decisions about what to build next. 

Want to get a sneak peek at the latest and greatest in Tableau? Visit our Coming Soon page to learn more about what we’re working on next. Happy mapping!