


Azure IoT makes it relatively easy to build an IoT application from scratch. In this tutorial, you’ll find out how to do it.
This article is an excerpt from the book, Enterprise Internet of Things Handbook, written by Arvind Ravulavaru. This book will help you work with various trending enterprise IoT platforms.
End-to-end communication
To get started with Azure IoT, we need to have an Azure account. If you do not have an Azure account, you can create one by navigating to this URL: https://azure.microsoft.com/en-us/free/.
Once you have created your account, you can log in and navigate to the Azure portal or you can visit https://portal.azure.com to reach the required page.
Setting up the IoT hub
The following are the steps required for the setup. Once we are on the portal dashboard, we will be presented with the dashboard home page as illustrated here:

- Click on +New from the top-left-hand-side menu, then, from the Azure Marketplace, select Internet of Things | IoT Hub, as depicted in the following screenshot:

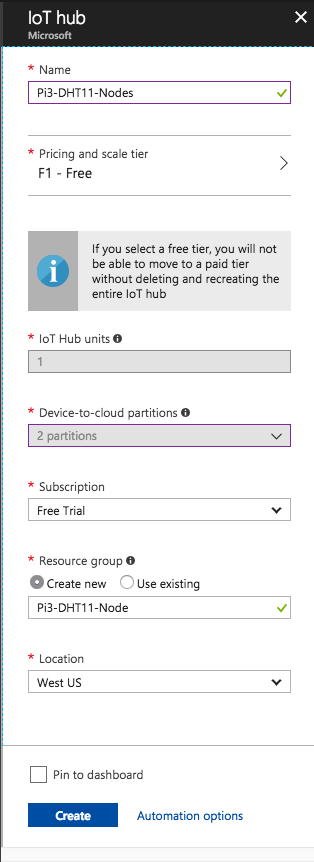
- Fill in the IoT hub form to create a new IoT hub, as illustrated here:
- Now, click on the Create button. It will take a few minutes for the IoT hub to be provisioned. You can keep an eye on the notifications to see the status.
- If everything goes well, on your dashboard, under the All resources tile, you should see the newly created IoT hub. Click on it and you will be taken to the IoT hub page.
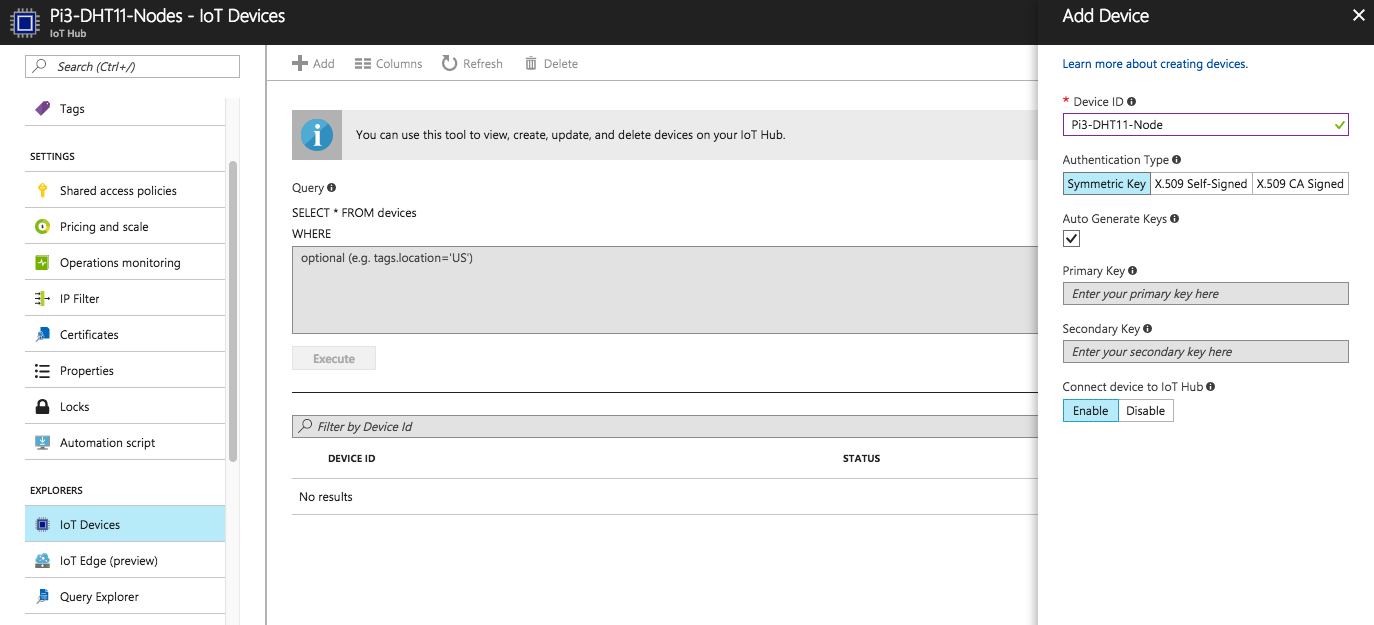
- From the hub page, click on IoT Devices under the EXPLORERS section and you should see something similar to what is shown in the following screenshot:

As you can see, there are no devices. Using the +Add button at the top, create a new device.
- Now, in the Add Device section, fill in the details as illustrated here:
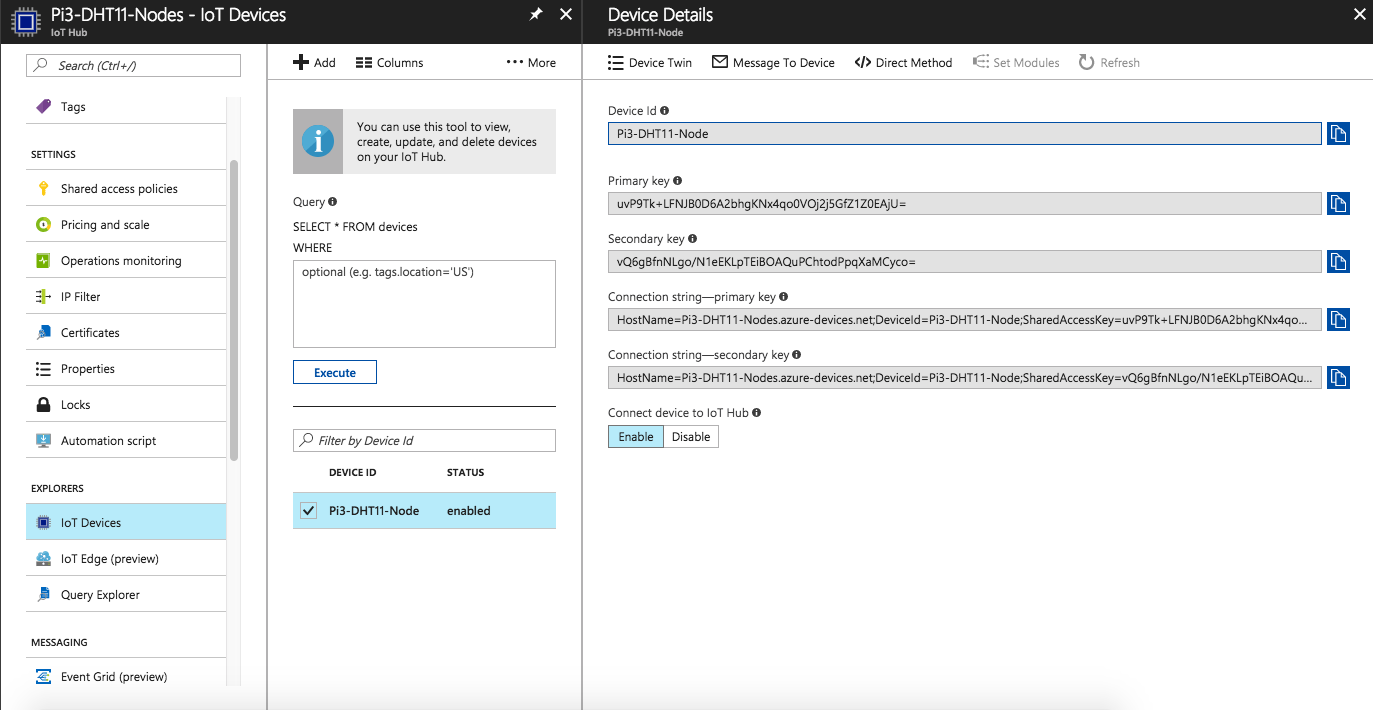
- Once the device is created, you can click on it to see the information shown in the following screenshot:

Do note the Connection string-primary key field. We will get back to this in our next section.
Setting up Raspberry Pi on the DHT11 node
Now that we have our device set up in Azure IoT, we are going to complete the remaining operations on the Raspberry Pi 3 to send data.
Things needed
The things required to set up the Raspberry Pi DHT11 node are as follows:
- One Raspberry Pi 3: https://www.amazon.com/Raspberry-Pi-Desktop-Starter-White/dp/B01CI58722
- One breadboard: https://www.amazon.com/Solderless-Breadboard-Circuit-Circboard-Prototyping/dp/B01DDI54II/
- One DHT11 sensor: https://www.amazon.com/HiLetgo-Temperature-Humidity-Arduino-Raspberry/dp/B01DKC2GQ0
- Three male-to-female jumper cables: https://www.amazon.com/RGBZONE-120pcs-Multicolored-Dupont-Breadboard/dp/B01M1IEUAF/
The steps for setting up the smart device are as follows:
- Connect the DHT11 sensor to the Raspberry Pi 3 as shown in the following schematic:

- Next, power up the Raspberry Pi 3 and log into it.
- On the desktop, create a new folder named Azure-IoT-Device. Open a new Terminal and cd into this newly created folder.
Setting up Node.js
If Node.js is not installed, please refer to the following steps:
- Open a new Terminal and run the following commands:
$ sudo apt update
$ sudo apt full-upgrade
- This will upgrade all the packages that need upgrades. Next, we will install the latest version of Node.js. We will be using the Node 7.x version:
$ curl -sL https://deb.nodesource.com/setup_7.x | sudo -Ebash-
$ sudo apt install nodejs
- This will take a moment to install, and, once your installation is done, you should be able to run the following commands to see the versions of Node.js and NPM:
$ node -v
$ npm -v
Developing the Node.js device app
Now we will set up the app and write the required code:
- From the Terminal, once you are inside the Azure-IoT-Device folder, run the following command:
$ npm init -y
- Next, we will install azure-iot-device-mqtt from NPM (https://www.npmjs.com/package/azure-iot-device-mqtt). This module has the required client code to interface with Azure IoT.
Along with this, we are going to install the azure-iot-device (https://www.npmjs.com/package/azure-iot-device) and async modules (https://www.npmjs.com/package/async). Execute the following command:
$ npm install azure-iot-device-mqtt azure-iot-device async --save
- Next, we will install rpi-dht-sensor from NPM (https://www.npmjs.com/package/rpi-dht-sensor). This module will help to read the DHT11 temperature and humidity values. Run the following command:
$ npm install rpi-dht-sensor --save
- Your final package.json file should look like this:
{
  "name":"Azure-IoT-Device",
  "version":"1.0.0",
  "description":"",
  "main":"index.js",
  "scripts":{
    "test":"echo"Error:notestspecified"&&exit1"
  },
  "keywords":[],
  "author":"",
  "license":"ISC",
  "dependencies":{
    "async":"^2.6.0",
    "azure-iot-device-mqtt":"^1.3.1",
    "rpi-dht-sensor":"^0.1.1"
  }
}
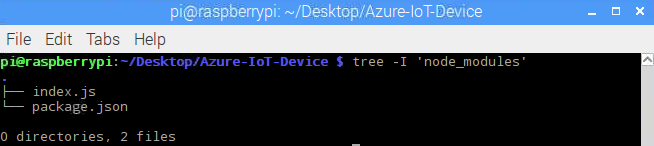
- Now that we have the required dependencies installed, let’s continue. Create a new file named index.js at the root of the Azure-IoT-Device folder. Your final folder structure should look similar to the following screenshot:
- Open index.js in any text editor and update it as illustrated in the code snippet that can be found here: https://github.com/PacktPublishing/Enterprise-Internet-of-Things-Handbook.
- In the previous code, we are creating a new MQTTS client from the connectionString. You can get the value of this connection string from IoT Hub | IoT Devices | Pi3-DHT11-Node | Device Details | Connection string-primary key as shown in the following screenshot:
- Update the connectionString in our code with the previous values. Going back to the code, we are using client.open(connectCallback) to connect to the Azure MQTT broker for our IoT hub, and, once the connection has been made successfully, we call the connectCallback(). In the connectCallback(), we get the device twin using client.getTwin(). Once we have gotten the device twin, we will start collecting the data, send this data to other clients listening to this device using client.sendEvent(), and then send the copy to the device twin using twin.properties.reported.update, so any new client that joins gets the latest saved data.
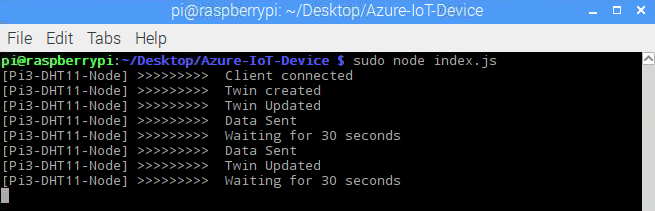
- Now, save the file and run the sudo node index.js command. We should see the command output in the console of Raspberry Pi 3:

The device has successfully connected, and we are sending the data to both the device twin and the MQTT event.
Now, if we head back to the Azure IoT portal, navigate to IoT Hub | IoT Device | Pi3-DHT11-Node | Device Details and click on the device twin, we should see the last data record that was sent by the Raspberry Pi 3, as shown in the following image:

Now that we are able to send the data from the device, let’s read this data from another MQTT client.
Reading the data from the IoT Thing
To read the data from the device, you can either use the same Raspberry Pi 3 or another computer. I am going to use my MacBook as a client that is interested in the data sent by the device:
- Create a folder named test_client. Inside the test_client folder, run the following command:
$ npm init --yes
- Next, install the azure-event-hubs module (https://www.npmjs.com/package/azure-event-hubs) using the following command:
$ npm install azure-event-hubs --save
- Create a file named index.js inside the test_client folder and update it as detailed in the following code snippet:
var EventHubClient = require('azure-event-hubs').Client;
var connectionString = 'HostName=Pi3-DHT11-Nodes.azure-devices.net;SharedAccessKeyName=iothubowner;SharedAccessKey=J0MTJVy+RFkSaaenfegGMJY3XWKIpZp2HO4eTwmUNoU=';
constTAG = '[TESTDEVICE]>>>>>>>>>';
var printError = function(err) {
  console.log(TAG, err);
};
var printMessage = function(message) {
  console.log(TAG, 'Messagereceived:', JSON.stringify(message.body));
};
var client = EventHubClient.fromConnectionString(connectionString);
client.open()
  .then(client.getPartitionIds.bind(client))
  .then(function(partitionIds) {
  returnpartitionIds.map(function(partitionId) {
    returnclient.createReceiver('$Default', partitionId, { 'startAfterTime': Date.now() })
    .then(function(receiver) {
      //console.log(TAG,'Createdpartitionreceiver:'+partitionId)
      console.log(TAG, 'Listening...');
      receiver.on('errorReceived', printError);
      receiver.on('message', printMessage);
    });
  });
})
.catch(printError);
- In the previous code snippet, we have a connectionString variable. To get the value of this variable, head back to the Azure portal, via IoT Hub | Shared access policies | iothubowner | Connection string-primary key as illustrated in the following screenshot:

- Copy the value from the Connection string-primary key field and update the code. Finally, run the following command:
$ node index.js
The following console screenshot shows the command’s output:

This way, any client that is interested in the data from this device can use this approach to get the latest data.
You can also use an MQTT library on the client side to do the same, but do keep in mind that this is not advisable as the connection string is exposed. Instead, you can have a backend micro service that can achieve the same for you and then expose the data via HTTPS.
With this, we conclude the section on posting data to Azure IoT and fetching that data. In the next section, we are going to work with building a dashboard for our data.
Building a dashboard
Now that we have seen how a client can read data from our device on demand, we will move to building a dashboard on which we will show data in real time.
For this, we are going to use an Azure stream analytics job and Power BI.
Azure stream analytics
Azure stream analytics is a managed event-processing engine set up with real-time analytic computations on streaming data. It can gather data coming from various sources, collate it, and stream it into a different source. Using stream analytics, we can examine high volumes of data streamed from devices, extract information from that data stream, and identify patterns, trends, and relationships.
Read more about Azure stream analytics.
Power BI
Power BI is a suite of business-analytics tools used to analyze data and share insights. A Power BI dashboard updates in real time and provides a single interface for exploring all the important metrics. With one click, users can explore the data behind their dashboard using intuitive tools that make finding answers easy.
Creating dashboards and accessing them across various sources is also quite easy.
Read more about Power BI.
As we have seen in the architecture section, we are going to follow the steps given in the next section to create a dashboard in Power BI.
Execution steps
These are the steps that need to be followed:
- Create a new Power BI account. Set up a new consumer group for events (built-in endpoint).
- Create a stream analytics job. Set up input and outputs.
- Build the query to stream data from the Azure IoT hub to Power BI.
- Visualize the datasets in Power BI and build a dashboard.
So let’s get started.
Signing up to Power BI
Navigate to the Power BI sign-in page, and use the Sign up free option and get started today form on this page to create an account. Once an account has been created, validate the account.
Log in to Power BI with your credentials and you will land on your default workspace.
Setting up events
Now that we have created a new Power BI, let’s set up the remaining pieces:
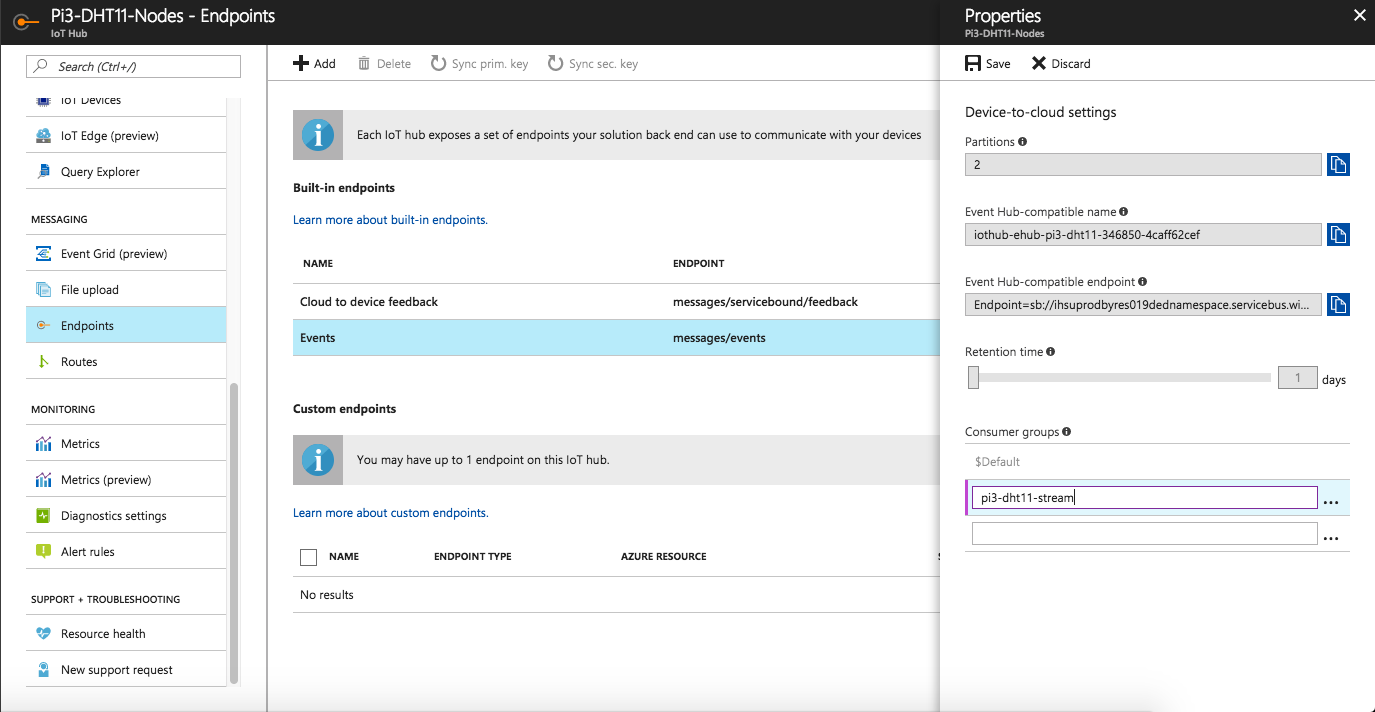
- Head back to https://portal.azure.com and navigate to the IoT hub we have created. From the side menu inside the IoT hub page, select Endpoints then Events under the Built-in endpoints section.
- When the form opens, under the Consumer groups section, create a new consumer group with the name, pi3-dht11-stream, as illustrated, and then click on the Save button to save the changes:
Next, we will create a new stream analytics job.
Creating a stream analytics job
Let’s see how to create a stream analytics job by following these steps:
- Now that the IoT hub setup is done, head back to the dashboard. From the top-left menu, click on +New, then Internet of Things and Stream Analytics job, as shown in the following screenshot:

- Fill in the New Stream Analytics job form, as illustrated here:
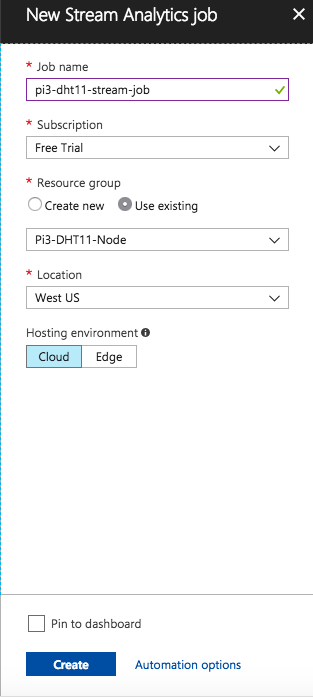
- Then click on the Create button. It will take a couple of minutes to create a new job. Do keep an eye on the notification section for any updates.
- Once the job has been created, it will appear on your dashboard. Select the job that was created and navigate to the Inputs section under JOB TOPOLOGY, as shown here:

- Click on +Add stream input and select IoT Hub, as shown in the previous screenshot.
- Give the name pi3dht11iothub to the input alias, and click on Save.
- Next, navigate to the Outputs section under JOB TOPOLOGY, as shown in the following screenshot:
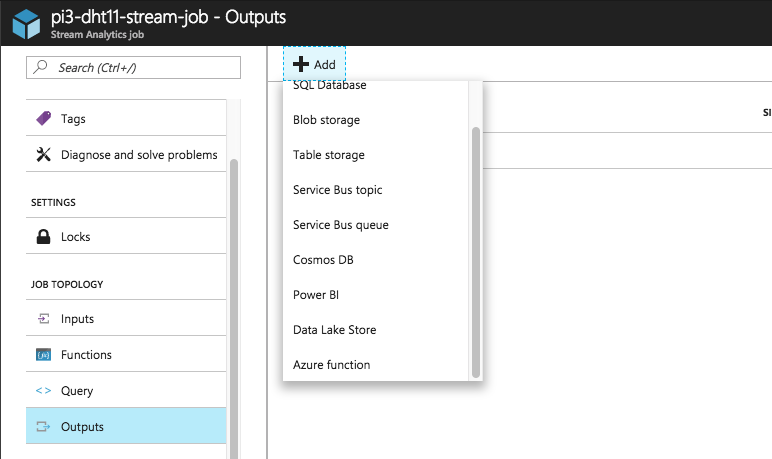
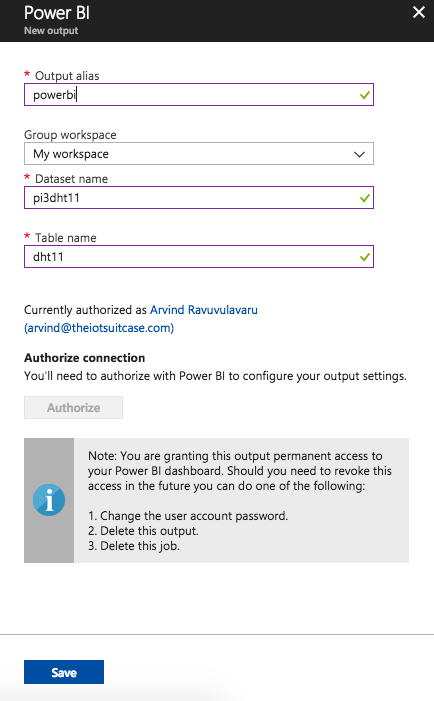
- Click +Add and select Power BI, as shown in the previous screenshot. Fill in the details given in the following table:
| Field | Value |
| Output alias | powerbi |
| Group workspace | My workspace (after completing the authorization step) |
| Dataset name | pi3dht11 |
| Table name | dht11 |
- Click the Authorize button to authorize the IoT hub to create the table and datasets, as well as to stream data. The final form before creation should look similar to this:
- Click on Save. Next, click on Query under JOB TOPOLOGY and update it as depicted in the following screenshot:

- Now, click on the Save button. Next, head over to the Overview section, click on Start, select Now, and then click on Start:

Once the job starts successfully, you should see the Status of Running instead of Starting.
Running the device
Now that the entire setup is done, we will start pumping data into the Power BI.
Head back to the Raspberry Pi 3 that was sending the DHT11 temperature and humidity data, and run our application.
We should see the data being published to the IoT hub as the Data Sent log gets printed:
Building the visualization
Now that the data is being pumped to Power BI via the Azure IoT hub and stream analytics, we will start building the dashboard:
- Log in to Power BI, navigate to the My Workspace that we selected when we created the Output in the Stream Analytics job, and select Datasets. We should see something similar to the screenshot illustrated here:

- Using the first icon under the ACTIONS column, for the pi3dht11 dataset, create a new report.
- When you are in the report page, under VISUALIZATIONS, select line chart, drag EventEnqueuedUtcTime to the Axis field, and set the temp and humd fields to the values as shown in the following screenshot:

- You can also see the graph data in real time. You can save this report for future reference.
This wraps up the section of building a visualization using Azure IoT hub, a stream analytics job, and Power BI.
With this, we have seen the basic features and implementation of an end to end IoT application with Azure IoT platform.
If you found this post useful, do check out the book, Enterprise Internet of Things Handbook, to build end-to-end IoT solutions using popular IoT platforms.
Read Next:
Introduction to IOT
Introducing IoT with Particle’s Photon and Electron
Five developer centric sessions at IoT World 2018
Okey, now I have a better understanding how everything works together
I did this on raspbian and it kinda worked directly, only minor problems cuz im in the learning stage!
Thank you!!!
Thanks Per!
First, thank you! I was able to run everything but I have a problem with the time of the twin device. It does not match the raspberrypi. You can help?